GS trade ideas

GS | Its a Long Way Down | ShortThe Goldman Sachs Group, Inc., a financial institution, provides a range of financial services for corporations, financial institutions, governments, and individuals worldwide. It operates through four segments: Investment Banking, Global Markets, Asset Management, and Consumer & Wealth Management. The company's Investment Banking segment provides financial advisory services, including strategic advisory assignments related to mergers and acquisitions, divestitures, corporate defense activities, restructurings, and spin-offs; and middle-market lending, relationship lending, and acquisition financing, as well as transaction banking services. This segment also offers underwriting services, such as equity underwriting for common and preferred stock and convertible and exchangeable securities; and debt underwriting for various types of debt instruments, including investment-grade and high-yield debt, bank and bridge loans, and emerging-and growth-market debt, as well as originates structured securities. Its Global Markets segment is involved in client execution activities for cash and derivative instruments; credit and interest rate products; and provision of equity intermediation and equity financing, clearing, settlement, and custody services, as well as mortgages, currencies, commodities, and equities related products. The company's Asset Management segment manages assets across various classes, including equity, fixed income, hedge funds, credit funds, private equity, real estate, currencies, and commodities; and provides customized investment advisory solutions, as well as invests in corporate, real estate, and infrastructure entities. Its Consumer & Wealth Management segment offers wealth advisory and banking services, including financial planning, investment management, deposit taking, and lending; private banking; and unsecured loans, as well as accepts saving and time deposits. The company was founded in 1869 and is headquartered in New York, New York.
GOLDMAN SACHS GROUP INC.Sunday, 13 November 2022
19:47 PM (WIB)
The Goldman Sachs Group, Inc. engages in global investment banking, securities, and investment management, which provides financial services. It operates through the following business segments: Investment Banking, Global Markets, Asset Management, and Consumer & Wealth Management.
The Investment Banking segment serves public and private sector clients around the world and provides financial advisory services, helping companies raise capital to strengthen and grow their businesses and provide financing to corporate clients. The Global Markets segment serves its clients who buy and sell financial products, fund and manage risk. The Asset Management segment provides investment services to help clients preserve and grow their financial assets.
The Consumer & Wealth Management segment helps clients to achieve their individual financial goals by providing wealth advisory and banking services. The company was founded by Marcus Goldman in 1869 and is headquartered in New York, NY.


RSI extremes in GSYes, I'm very contrarian here. Lots of GS puts based purely on daily RSI. Long time to fill that gap, now we there.

Goldman Sachs to aim for the 400Goldman ist about to bounce from its trend line and aim for the 400 Area. After having seen the quarter results from the largest banks in the United States, Goldman Sachs is dong exceptionally well compared to its peer industry. Expectations were beaten and that is reflected on the smooth movement of its price during the latest bear market. Longterm the target of 400 can be expected - lets see.


Symmetrical TriangleThere appears to be a W formation inside the triangle.
Triangles are neutral patterns.
Price is above resistance line of the triangle today but it is not a confirmed uptrend.
Candle of indecision today.
No recommendation.
$GS with a Bullish outlook following its earnings #Stocks The PEAD projected a Bullish outlook for $GS after a Negative over reaction following its earnings release placing the stock in drift B with an expected accuracy of 100%.

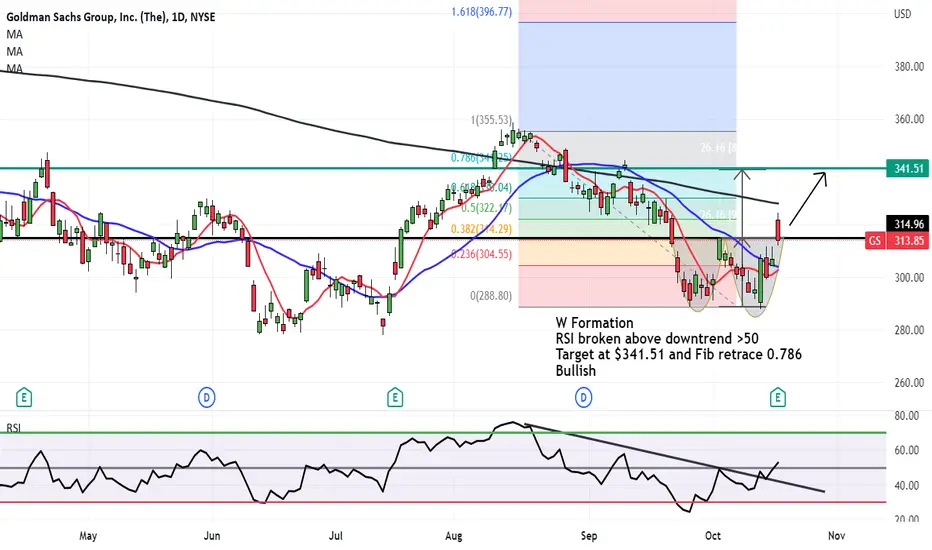
Golden Sachs quick run to $341.51W Formation formed on Goldman Sachs
RSI broken above downtrend >50
Target at $341.51 and Fib retrace 78.6%
Bullish
Buy 2 shares of ABBV for every One share of GS Goldman Sachs Group
AbbVie Inc
---
1- No stop loss.
2- 5x leverage NoT More!
Becareful! Not more than leverage 5.
-
for buying shares:
warning: Only leverage 5, Do Not Take More Than leverage 5.
-
for options is Excellent:
Two call option 3 months contract of for every One 3 months contract of .
----
Happy Trading!

Banking Stocks: Goldman Sachs (-8%)Goldman Sachs invests in many types of derivatives like CDS, stock options, stocks, and anti-exposition derivatives. As banking stocks will be down in that period until maybe the middle of November, stocks with High Net Worth clients will go down.

Bearish on Goldman. GSGoldman Sachs is another major company we have been following. Shaky fundamentals and the fractal picture of the stock price drive us to a bearish stance on this one.
We are not in the business of getting every prediction right, no one ever does and that is not the aim of the game. The Fibonacci targets are highlighted in purple with invalidation in red. Confirmation level, where relevant, is a pink dotted, finite line. Fibonacci goals, it is prudent to suggest, are nothing more than mere fractally evident and therefore statistically likely levels that the market will go to. Having said that, the market will always do what it wants and always has a mind of its own. Therefore, none of this is financial advice, so do your own research and rely only on your own analysis. Trading is a true one man sport. Good luck out there and stay safe.

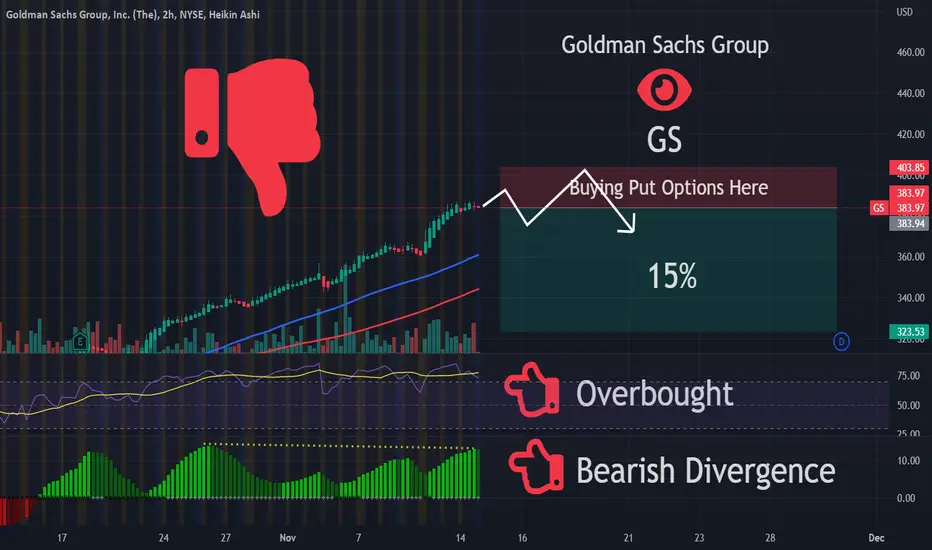
Goldman Sachs Group Analyze 🦀!!!Goldman Sachs Group succeeded in making a Bearish 🦀Crab🦀 Harmoni Pattern near the resistance line.
I expect that Goldman Sachs Group will lose at least 15% of its value.
The 🎯target🎯of this downtrend can continue at least to the trend line.
Goldman Sachs Group Analyze (GSUSD), Timeframe 1H⏰(Log scale).
Do not forget to put Stop loss for your positions (For every position that you want to open).
Please follow your strategy, this is just my Idea, and I will be glad to see your ideas in this post.
Please do not forget the ✅' like '✅ button 🙏😊 & Share it with your friends; thanks, and Trade safe.

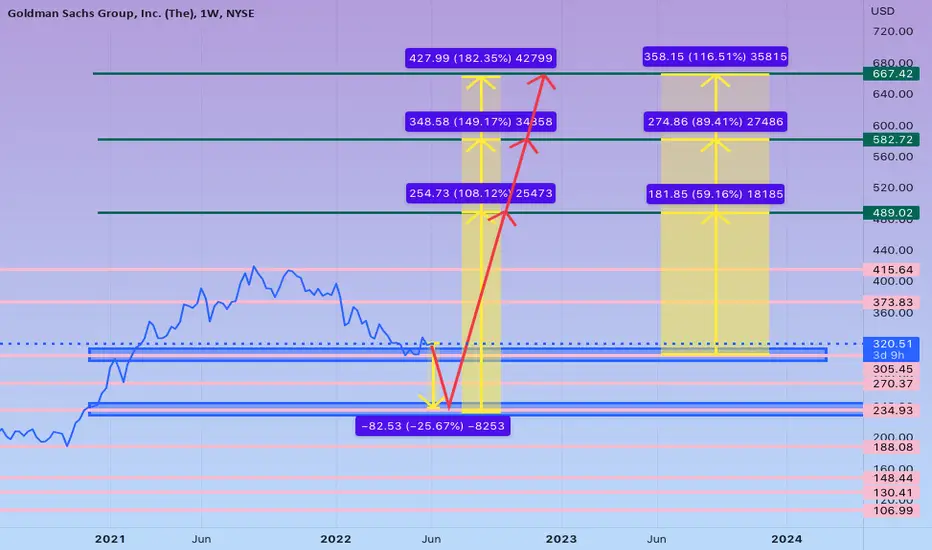
$GS | Weekly - Short SetupSetting this up in preparation for potential short below the 280 level, with a target at 1 to 1.272 extension.

Shark/BEARISHExtended Shark with the last leg hitting the 1.113.
Price is above the 50% retracement of the trend up but below the .382.
No recommendation.

9/18/22 GSGoldman Sachs Group, Inc. ( NYSE:GS )
Sector: Finance (Investment Banks/Brokers)
Market Capitalization: $112.036B
Current Price: $326.21
Breakout Price: $335.15
Buy Zone (Top/Bottom Range): $325.35-$306.65
Price Target: $361.40-$363.50
Estimated Duration to Target: 60-63d
Contract of Interest: $GS 11/18/22 330c
Trade price as of publish date: $15.45/contract

GS short entryHello dear Traders,
Here is my idea for #GS
Price closed below yellow line (previous month low)
Price closed below purple trigger line to enter trade.
Targets marked in the chart (black lines)
Invalidation level marked with red line
Good luck!
❤️Please feel free to ask any question in comments. I will try to answer all! Thank you.
Please, support my work with like, thank you!❤️

GS: textbook Elliott wave count?A textbook wave count is busy unfolding after the break out of the WZ wedge.
The expectation is for the price action to target T1 and T2.
Crossing below S1 at 32610 will act as some major support.
Remains a risky trade.

GS strong sellEntry: 343
TP1: 330 +3.9%
TP2: 319 +7.5%
TP3: 305 +12.5%
SL: 352 -2.5%
Period length: 30-32 days

'#GS short ideaHello dear Traders,
Here is my idea for #GS
Price closed on daily chart below yellow trigger line (previous month low) - Trade active.
Targets marked in the chart (black lines)
Invalidation level marked with red line
Please feel free to ask any question in comments. I will try to answer all! Thank you

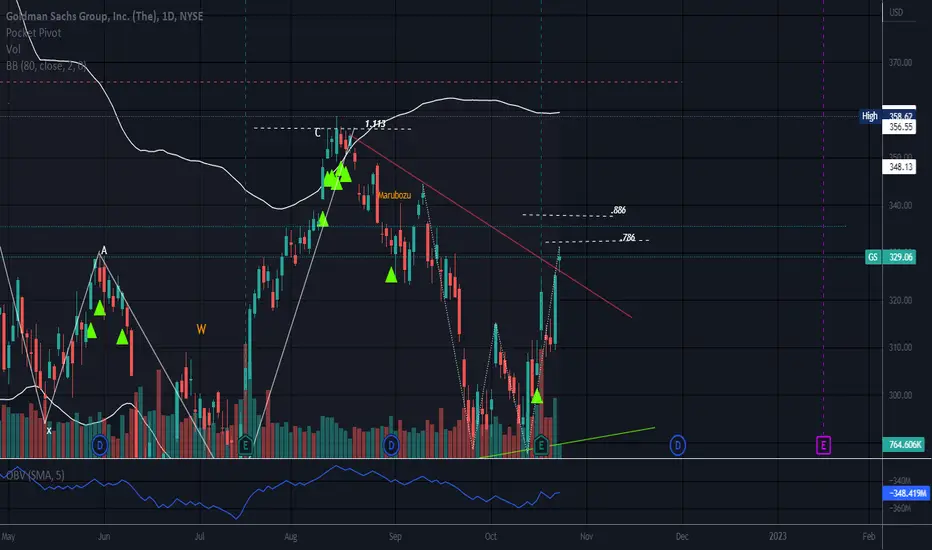
Bearish SharkPrice has met Target 1 which is the top of the hump in the crooked W.
This is often a support level and price is hanging on this level right now.
The 4th leg appears to have terminated at the 1.113.
The Shark is labeled OXABC. This is an Alternate Shark. There is a version that ends at the .886 of OX.
Price is below the 200 DMA but is still above the 50.
No recommendation.

TO GOLDMAN FROM JEFFGoldman Sachs Group, Inc. engages in global investment banking, securities, and investment management, which provides financial services. It operates through the following business segments: Investment Banking, Global Markets, Asset Management, and Consumer & Wealth Management. The Investment Banking segment serves public and private sector clients around the world and provides financial advisory services, helping companies raise capital to strengthen and grow their businesses and provide financing to corporate clients. The Global Markets segment serves its clients who buy and sell financial products, funding and managing risk. The Asset Management segment provides investment services to help clients preserve and grow their financial assets. The Consumer & Wealth Management segment helps clients to achieve their individual financial goals by providing wealth advisory and banking services. The company was founded by Marcus Goldman in 1869 and is headquartered in New York, NY.
IM WAITING FOR THE NICE 25% DISCOUNT IN GOLDMAN
THEN I BEGIN MY SHOPPING SPREE
as for day trading im in a short swing
i thought it was recovering but i dont think so anymore
SENNA SEASON