HD trade ideas

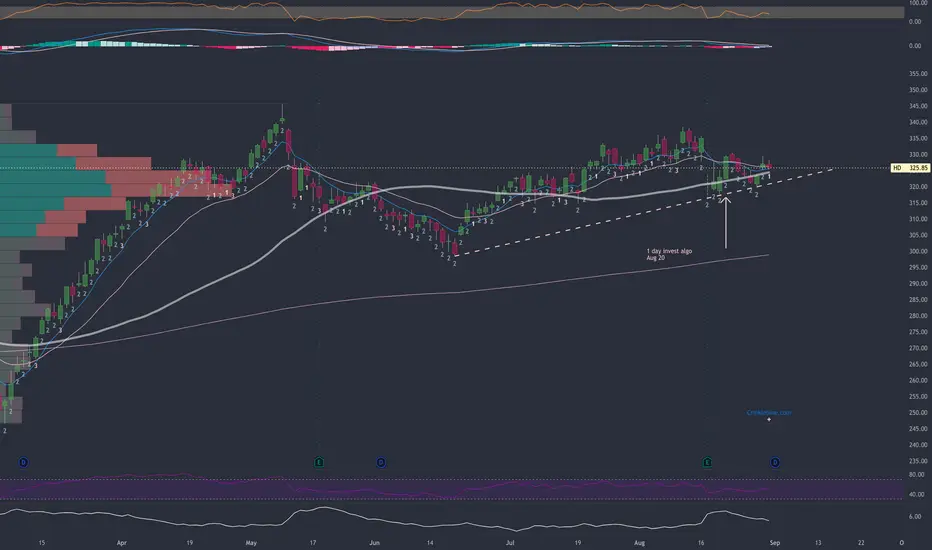
HD to retest breakoutStrength in Dow Jones is keeping this from dumping full throttle but as you can see it's broken its trendline
MFI over bought
RSI curling


Cup and Handle Ascending TrianglePrice is above the bands set on 80 SMA. Very bullish and shows a ton of momentum. Closing in on Targets 1.
I get a bit nervous when price is over the top band set on 80 as price usually returns the bands. When price is over the top band, it is almost always overbought. Price can remain outside the top band and in overbought condition for a while in some cases with extreme momentum or a security may just ride the top band while slightly over the top band.
Targets 2 are long term and may or may not be met. My focus is on targets 1 as I do own this.
No recommendation.
Trying to reach for the stars here, but keeping my feet on the ground.
You can measure the wide end of a triangle at the side end and project it from the bottom trendline of a triangle to get a guesstimate of where price may go. Any triangle can break up or down. This one broke to the upside.
RSI is set on 80 verses 70.


HD breaking out!* Exceptional earnings year-over-year
* Very strong up trend
* Breaking out of a 5 month consolidation with slightly more volume than average
* Pays out dividends with a Payout Ratio of 44.10% which means the company has more room for growth and potentially increase dividends as well.
Trade Idea:
* You can enter now as indicated if you don't mind a little volatility
* Given that it only broke out with slightly higher than average volume, this may visit the 339 area before heading higher.


HD: Short term buyAll trade in sell order/buy order, might not trigger, cancel if the price has run too far.

$HD Plan for this weekPotential inverse head and shoulder forming for a break to the upside
If that pattern fails and we are unable to bounce at the bottom of the channel bearish pts are given as well

HD We are in a big rising wedge. We did
Breach support howver we bounced off daily 200
Ema
So as long as we maintain above that we can see another push to upper rising resiatnc at 345$ 200 ema is at 323$ Rising wedge supprr 328. Might be worthy trade long up to 344/345 and then Dump it


HDHome depot could bounce here for a nice swing
Has bounced off trendline everytime.
First and 2nd pt is 344 and 350


HD: Ascending Triangle (26%)Home depot could see an additionnal uptick.
Ascending Triangle, Not confirmed yet. Must break through the 340$ resistance first with volume.
If confirmed:
Price target = 430$
Stay humble, have fun, make money!


Home Depot; Previous crash haven worth an analytical eyeDisclaimer
This analyst has been curious on NYSE:HD for quite some time, especially considering the massive amount of growth over the last few years. This analyst keeps their investments in Home Depot limited to buying at Home Depot (except plumbing stuff which Lowes has better of), but the curiosity remains all the same. Looking at recent ownership changes among institutions here , we see the classic major shareholders, but among the top and most recent actions, are sells. Short interest is sitting around ~10 million shares in a massive float, yet the dividend ratio is still ~2%. This 2% is a magic number for companies as it is supposed to match a defined inflation rate and common gains rate.
In previous crashes, Home Depot maintained stable price, likely to do a small investor base that was relatively happy staying stable. As capitalism hungers, Home Depot starts taking off post 2008 when the US went on a massive weaponization of debt leading to a historic period of hyperinflation of equities.
I cannot recommend any investment on Home Depot, the fundamentals and mechanics unclear, investors philosophies unknown, no major patterns suggest themselves save for the steady impulse up, and where it ends is anyone's guess.
Sometimes the best thing to do in a crash, is nothing. There are always stocks full of investors that are willing to carry the investment through term on the hopes of tomorrow. May we all find shelter in these equities soon.

Bullish Pennant- BreakoutWatching HD closely here and looking for a breakout (Broader Market Conditions Permitting) -
- MACD is seemingly about to cross
- Bullish hammer right on the 50-day EMA
- Slight bullish divergence on the RSI
- just some support and resistance levels to keep an eye on along with some RSI based supply and demand zones
PT1- $325.78
PT2- $328.73
PT3- $329.49+

Home depot Bear flagHuge bear flag on homedepot. but a even bigger double top
Had a nice dead cat bounce with hurricane IDA news now back to regularly schedule. Oscillators have all went bearish
Short entry below 323
1tp 315
2nd tp 291
Final TP 253

$HD - call optionsI may add more calls before this takes off.
I picked up Nov 19th expiration at 325 strike. I think it has a move in september - could get an assist from another round of covid lockdowns
Pull Back Fishing Cup & HandleFollowing some rules, as I have seen many, HD has negated a cup and handle pattern because price has fallen below the handle low and it is not below mid cup which is 322.04. The handle low is 316.61. There should be a lot of support between these 2 levels, as both mid cup and the handle low provide a form of support. The pull back at earnings may have made this a safer trade.
The moving averages are in chronological order with the 20 on top, but the 20 is looking a bit droopy with price underneath it. The longer term SMAs are sloping up indicating for now, price is in good shape long term. Moving averages are lagging indicators compared with price, which is what is going on in the present.
Negative volume is high showing smart money interest. Short interest is very low.
I watched this fall out of the rising wedge on hourly yesterday, as there is also a rising wedge on hourly but this is a daily chart. It did not fall far and price recovered at 323.11. I am hoping it has corrected but could be shaky for a bit so long entry level can be paramount. No way to know for sure.
No recommendation.
When a wealthy trader with no experience meets a seasoned trader with experience, the rich trader walks away with the experience and the experienced trader walks away with the money.

$HD with a Bullish outlook following its earnings #Stocks The PEAD projected a Bullish outlook for $HD after a Negative over reaction following its earnings release placing the stock in drift C.
If you would like to see the Drift for another stock please message us. Also click on the Like Button if this was useful and follow us or join us.
