IBM Corp Weekly (23) Chart Technical AnalysisThe IBM (IBM) weekly chart shows the following signs:
The Price of IBM came into the KUMO and stopped at Kijun Sen resistance. The Stock is over the EMA200 making a triple bottom from Oct 2013 till Feb 2014 on it. The MACD and RSI are mixed to bearish.
If today (Monday) the stock is long, the next target is the resistance of Tenkan Sen at around the $190. Otherwise the bearish signal could be given under the weekly support line for the strong support line first at around the $172.
IBM trade ideas

Long distance to the next support.Month begins with rise. It is important that it will be completed by fall.

IBM Corp Weekly (22) Chart Technical AnalysisThe IBM (IBM) weekly chart shows the following signs:
The Price of IBM decline under the KUMO and under the Kijun Sen support. The Stock is over the EMA200 making a triple bottom from Oct 2013 till Feb 2014 on it. The MACD and RSI are both on bear signal.
I expect that the stock could continue the short movement until the EMA 200 Support for 4th time in a year as I had mentioned in previous weekly analysis

IBM Daily (26.05.2014) Chart Technical AnalysisThe IBM (IBM) daily chart shows the following signs:
The Price of IBM decline in the KUMO and under the Kijun Sen and Tenkan Sen support. The Stock is under the EMA200 and has stop on SPAN B of KUMO. The MACD and RSI are on bear signal.
I expect that the stock could continue the short movement because the SPAN A has cross down the SPAN B of shift 26 projection of KUMO. The only thing that could change the trend is a bullish correction towards Tenkan Sen but that would consider for neutral position.

IBM Corp WEEKLY (21) CHART TECHNICAL ANALYSIS The IBM (IBM) weekly chart shows the following signs:
The Price of IBM decline under the KUMO and over the Kijun Sen support. The Stock is over the EMA200 making a triple bottom from Oct 2013 till Feb 2014 on it. The MACD and RSI gave bear signal.
I expect that the stock could continue the short movement until the EMA 200 Support for 4th time in a year. The only thing that could change the trend is the overcome of KUMO cloud.


IBM Bump & DropFollowing current trends I want to call a price somewhere around $118 going into as far as 2016. It really doesn't look like this company has any more room to grow and a fall in share price is coming.
I have a feeling IBM will gain a bit more, possibly testing resistance again up around $205 making a good area to get shorts in.
The resistance arcs are more for arch views than any real calculation, the idea is the general reverse bowl shape being formed.
- - - - -
All opinions expressed by Emuffn3 on this website are solely Emuffn3’s opinions and do not reflect the opinions of TradingView, or their affiliates. You should not treat any opinion expressed by Emuffn3 as a specific inducement to make a particular investment or follow a particular strategy, but only as an expression of his opinion. Emuffn3’s opinions are based upon information he considers reliable, but neither TradingView nor its affiliates and/or subsidiaries warrant its completeness or accuracy, and it should not be relied upon as such. Emuffn3 is not under any obligation to update or correct any information provided on this website. Emuffn3’s statements and opinions are subject to change without notice.
Past performance is not indicative of future results. Neither Emuffn3 nor TradingView guarantees any specific outcome or profit. You should be aware of the real risk of loss in following any strategy or investment discussed. Strategies or investments discussed may fluctuate in price or value. Investors may get back less than invested. Investments or strategies mentioned on this website not be suitable for you. This material does not take into account your particular investment objectives, financial situation or needs and is not intended as recommendations appropriate for you. You must make an independent decision regarding investments or strategies mentioned. Before acting on information on this website, you should consider whether it is suitable for your particular circumstances and strongly consider seeking advice from your own financial or investment adviser.
Cheers!~
& Happy Trading!
Hold of on any real orders till we see motion one way or another, my outlook however, is quite bearish.

IBM pitchfan testThis is an experiment with the pitchfan in splitting the angle. The pitchfan set was determined from 3 earlier points in the chart. The center is not set on a real point. I am just using the angle spreads. The arcs are more reliable and tested. Don't make any decisions without being prepared for reversals if things go wrong.
The previous move was 4 angles up and 5 down. The last move was also 4 angles up, so I'm thinking 5 down. It also correlates with the arc ratio. I'll see if this pitchfan idea holds any merit or potential.

Pine Script - Relative Momentum IndicatorThis indicator was developed by Roger Altman and was introduced in the February 1993 issue of "Technical Analysis of Stocks & Commodities" magazine. The RSI was developed by J. Welles Wilder and is discussed in his book "New Concepts in Technical Trading".
Get the source here: pastebin.com
Installation video by @ChrisMoody here : vimeopro.com
After I got done coding this, I saw that www.tradingview.com had already coded the same indicator. Small differences, but same indicator, just want to give credit to a line leader.

196.00 is the level on this one IMHOBull flag below resistance, following a b/o from a nice base. #watchlist

IBM aims to stop the bearish correctionIBM price continues to offer positive attempts to stop the bearish correction that appears on the chart, as the price is leaning on the support base that 23.6% Fibonacci level forms at 181.35, making new attempts to confirm breaching the bearish correctional channel.
Stochastic offers positive signals on the daily time frame, which supports the chances of continuing the bullish bias in the upcoming period, noting that breaching 190.80 will provide strong positive motive that supports targeting the previously recorded top at 215.90.
Therefore, the bullish trend will be preferred in the upcoming period, conditioned by holding above 181.35

IBM Will Pull Back Here: Resistance Trend Line Alert International Business Machines Corp. (NYSE:IBM) is slamming into a key level of resistance. This level is at $181.15. Please note the chart below to see the trend line for yourself. Based on this resistance level and multiple other factors, IBM is an easy short here for a multi-day pullback. A $177.00 target can be used. Enjoy and profit for life.
Gareth Soloway
Chief Market Strategist
www.InTheMoneyStocks.com

IBM Wedge RetracementUsually would buy on the test of trend line, Little more caution with market conditions

IBM Daily Analysis 11/13/2014Still holding some longs overnight. Will close all long positions if unable to regain $186 tomorrow.


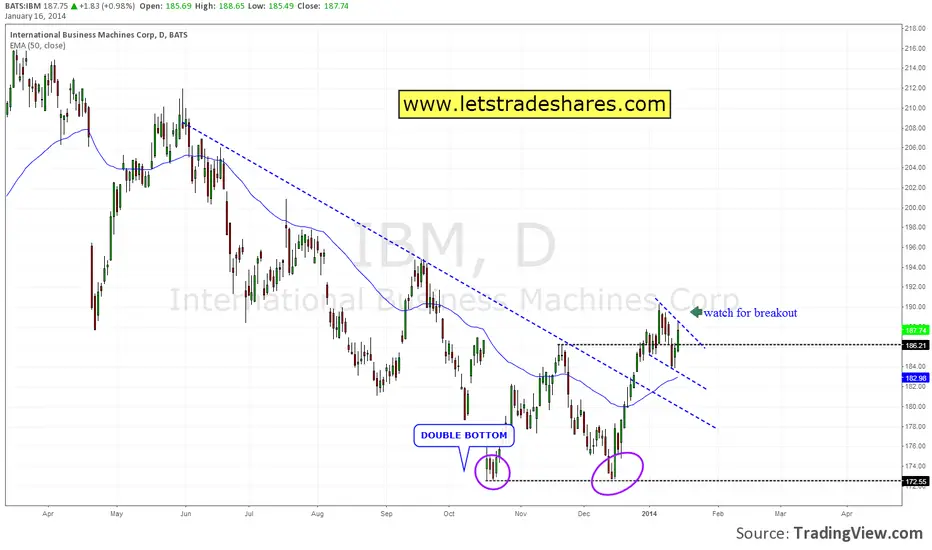
IBM Daily Analysis 1/1/2014IBM Looking strong. It break out of the $172-$186 area yesterday. It broke through the down-ward resistance as well as Oct 14's high before the gap. Overall, I think we are cleared to go up to $194, which is the next major area of resistance (Sept high). I think the stock may consolidate a bit either before or after reaching $194, as it will have become overbought.
The second target is $198. I think we will get there in Feb.
Long IBM. Jan $180 Calls BTO 12/31/13.

IBM Daily 12/28/13No position. Observation only. Possible long if breaks $186 with heavy volumes, or bounces off support at $173.

IBM Long DailyIBM reports on JAN 21. The stock is now
breaking out after being heavily sold
I am waiting to add to the position however until the chickou line
breaks through the cloud. This is a weak buy yet from a Ichimoku
perspective however I have traded Ibm alot and have seen how
it runs up or down going into earnings

IBM - Continuance of Down TrendIBM has continued testing and bouncing off the down trend resistance line. Past two attempts saw drops back down to what's now the bottom Bollinger band at around 172-173. IBM has under performed its sector for several months now, and has seen extended negative correlation with NDXT as it continues making higher highs.

