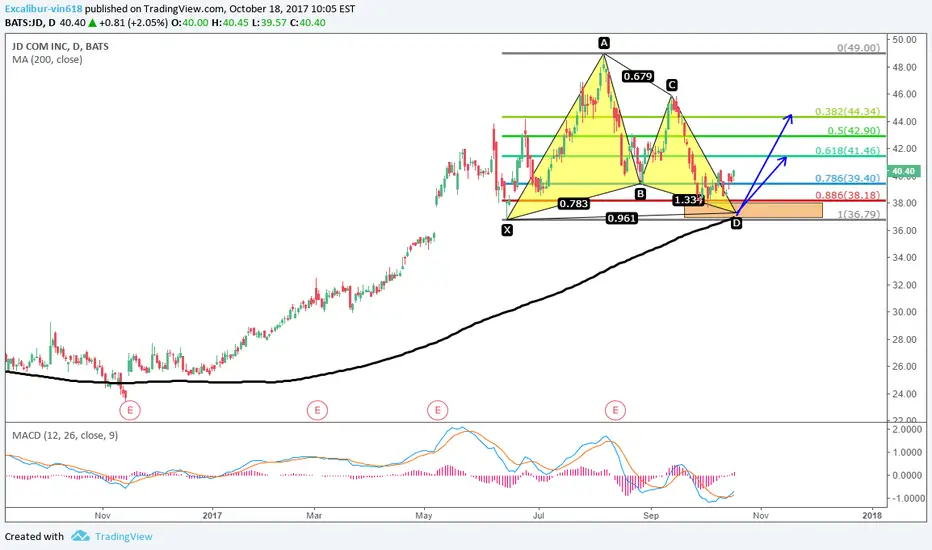
JD COM INC : Bullish Gartley Pattern, Buy the DipOn daily chart JD has completed a bullish gartley pattern at 37.45, and price has stand firm on 39 level with pin bar, together with gold cross over of MACDhints a further advance.
Buy the dip, and target can be set to 41.46, 43 and 44.34.
JD trade ideas
JD potential buy opportunitybuy point ~ 39
stop loss ~ 37
target ~ 45
risk ~ 5-6%
potential gain ~ 15-18%
1:3 risk to reward ratio
take this with a grain of salt. feel free to raise the stop loss instead of selling given that you believe JD will benefit from the growth of ecommerce in China. check them out.


Possible JD Trade / Gap UpMonthly and Weekly calls good to consider.
Feel free to comment if you have any input on this chart.
Thnx!


JD, Bullish Cypher patternJD.COM rallied from 20 to 49 within a year, and after it failed to break 49 fig level in 8/8 in addition to the earnings report in 8/8, it plunged about 20%.
JD is one of the most competitive competitor with BABA, as this BABA rocket keeps on surging to the sky, JD should also be attractive to those who are too scared to buy BABA above $165.
Based on this bullish Cypher pattern, it suggests to buy around 40.
While as always, I need at least one more reason to convince me, so I'll focus on if there are
1. Hammer
2. Double bottom
3. inside bar breakout
happened here , I don't mind if it happens on smaller time frame.
If so, it might be a good try to long and the potential out is below 38.50.


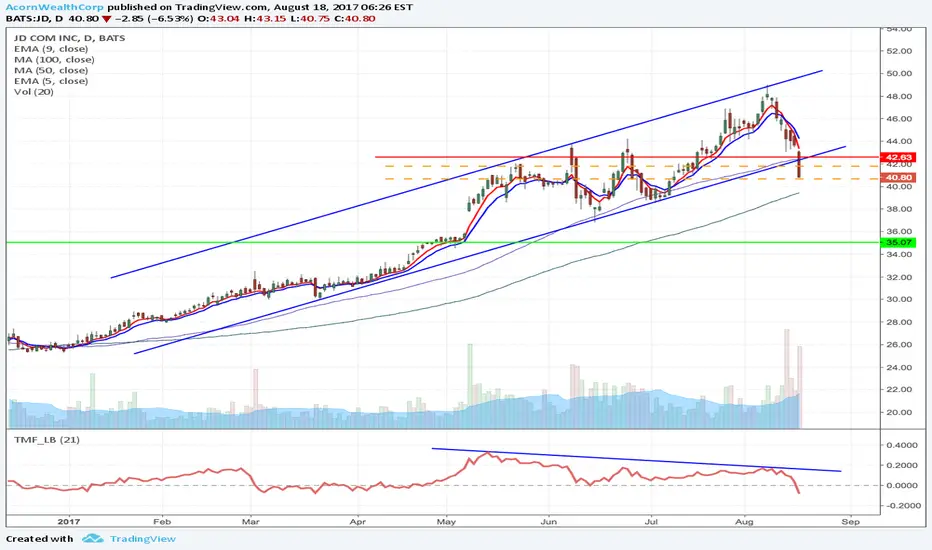
JD - Upward channel breakdown short form $41.80/40.67 to $35.07JD was in our watch list from quite a while as a short candidate. Now it has broken down its upward channel formation. It has potential to dropdown all they way down to $35 area. We think it will be a good short if it breaks down or retest channel line.
* Trade Criteria *
Date First Found- August 17, 2017
Pattern/Why- Upward channel breakdown short
Entry Target Criteria- Drop below $40.67 or rally back to $41.80
Exit Target Criteria- $35.07
Stop Loss Criteria- $42.63
Please check back for Trade updates. (Note: Trade update is little delayed here.)


JDJD is a strong stock and might shoot up after ER, but just take extra caution there's a chance it might retest the support and continue at the bottom blue line and also watch out the RSI.


Example where RSI gives a single powerful buy signalWow look at the current RSI levels there. Never seen them that high on a weekly chart before. Solid signals across the board here for an entry back there in April. RSI gives a signal along with price action breaking resistance. That signal carries more weight.

In the eyes of MACDusing two MACD time frames here to give better signals.
Remember to always draw trendlines when dealing with MACD. They can help give better signals when the trendline is broken along with another signal like a zero crossing.
MACD signals along with price action breaking resistance levels are signals that carry more weight. Better odds if you wait until "multiple stars align" so to speak.
As for the price action ending of the wekk of MAY 26 2017 We can seen the uper MACD is going to test a long term trend line. That one does not to seem to carry as much weight as the darker trendline just below it there. So look for uniform action coming off that line on the upper MACD. At the same time the lower MACD just made a cross. This by itself is not a sell signal. Signal crosses to the downside above the zero line tend to not be very powerful. Wait for the bottom MACD to test the zero line for a confirmation in a trend reversal to the downside. I hope that makes sense? If it does not I can clarify. ***On the topic of the lower MACD, I should have drawn a light trend line from the start of the NOV 2016 thru the peaks in Feb and May 2017. If I had, then I could say that cross that occur outside the trend line tend to be more powerful crosses and carry more weight. So yes, This could be taken as a neutral signal(no reason to be biased bearish), and you need to wait for more time to get more info; or it could be taken as a bearish signal-especially if it were to have a weeks worth of negative price action next week. Hop that makes sense to you guys?
Got a little lazy on the chart here so not everything is marked.
Shout Out to ERIC-MUATHE for teaching me what I know.
Note to self: Learn about gap strategies more. What to do about recent gap?


big jump for jd.com after good earning, it is very interestingbig jump for jd.com after good earning, it is very interesting

JD - another Chinese name setting up nicelyAnother Chinese name looking promising here with nice chart + earnings growth.

JD continue to see strength
JD has been captured gains since the beginning of the year. Already 10% till now.
Continue see strength and to see if JD could break 29.23 to higher. #Walmart has already increase stake in JD to 12%.
