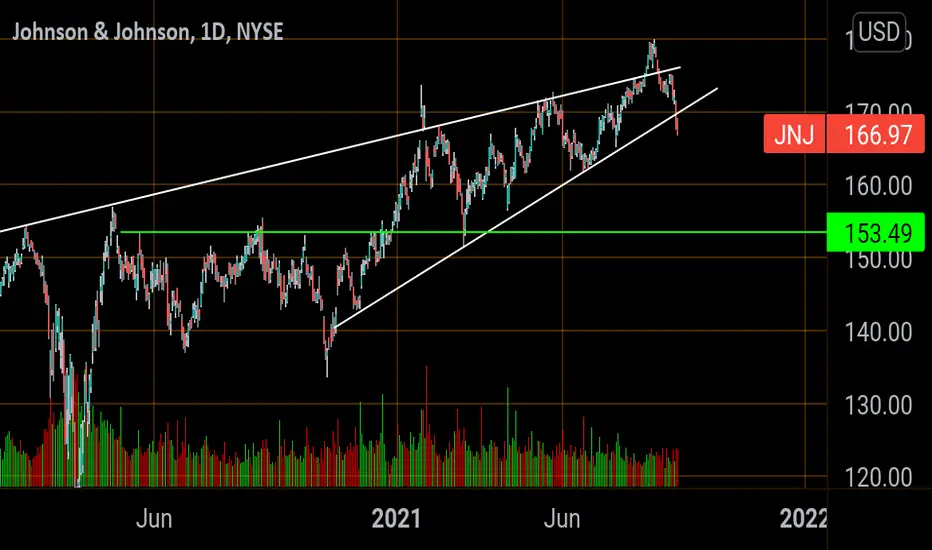
Correction for JNJ... Rising wedge patternI expect a dead cat bounce to follow the Dow then a sell off.
TP 153-155
JNJ trade ideas
JNJ Bull9/17 $180 CALLS currently going for $0.26.
All vaccines are looking like they want to run (PFE, NVAX, MRNA) etc

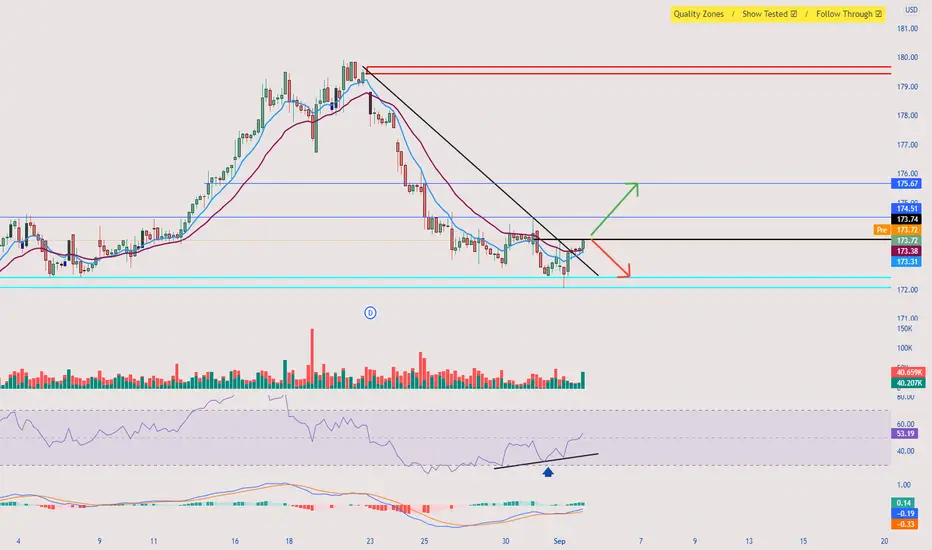
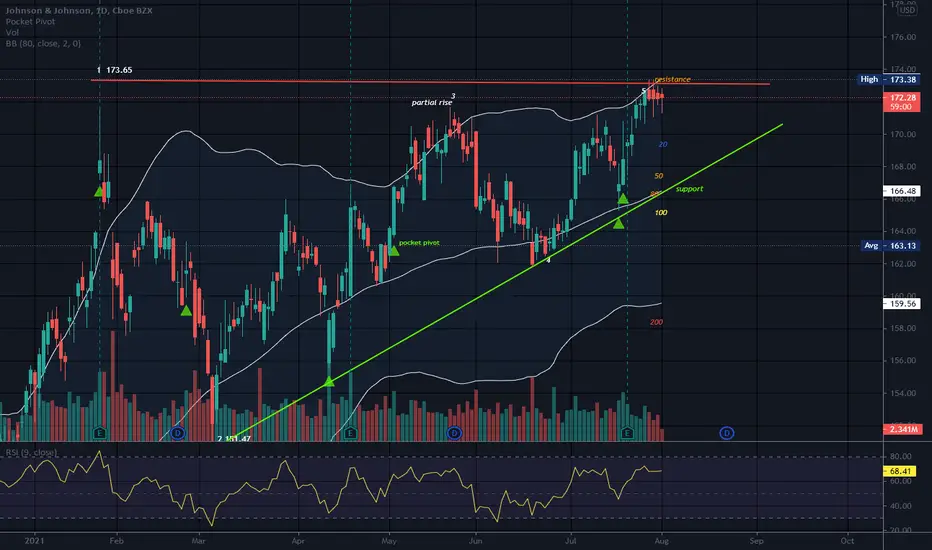
One more jump before downtrend?JNJ has been coming off a slow moving uptrend and it seems to be slowing down
- JNJ looks to test the previous high
+ Fibonacci extension has reversal at $168.5
+ Bottom of the channel has reversal at $169.87 - $169
- RSI is heading close to oversold
- Price broke through pitchfork so it looks to hit reversal in the next day or so
- If the price high tomorrow is under $171.12 that is a good indicator of jump
- Price target: $173.22

168 bounce coming?I like JNJ, but would like it to travel down to 168 before breaking through my purple fib trigger line.

$JNJ - Double bottom & breakout in hourly, watch for contiuation$JNJ - Double bottom & breakout in hourly, watch for contiuation
JNJ Ready to Continue Rising HigherThe share price of Johnson and Johnson looks ready to rebound from the major resistance-turned-support area, underpinned by the 23.6 per cent Fibonacci retracement level at 175.61, and resume climbing.
The underlying uptrend appears to be taking the form of a 1-5 impulse wave pattern, as postulated by the Elliott Wave Theory. Thus, the recent correction can be perceived as the second retracement leg (3-4). If the price action strengthens above the 23.6 per cent Fibonacci, this would allow for the subsequent emergence of the final impulse leg (4-5).
If, however, the correction breaks down below the lower limit of the support, underpinned by the 100-day MA (in blue), this would likely mean that it could then be extended lower towards the 38.2 per cent Fibonacci.


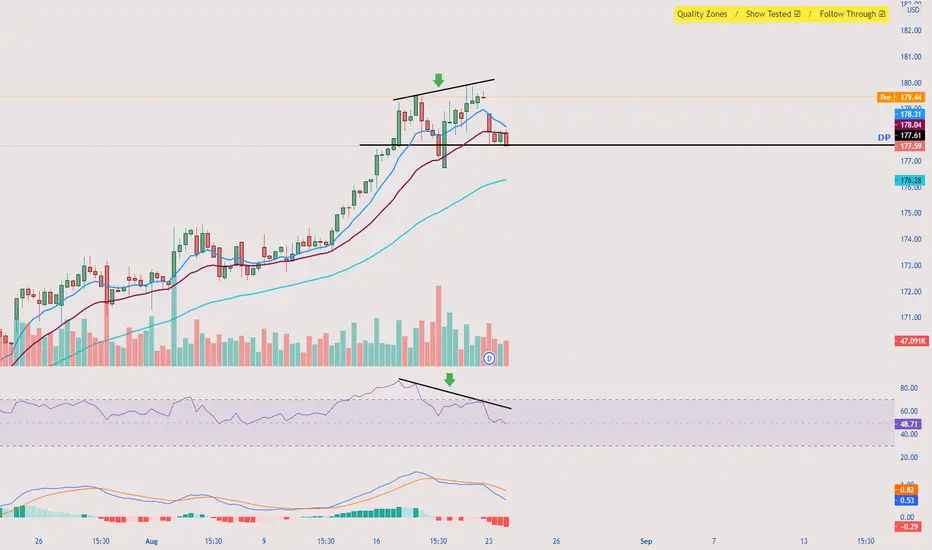
$JNJ - Double top with RSI bearish divergence, puts below 177$JNJ - Double top with RSI bearish divergence, puts below 177
UPDATE Johnson and Johnson! Buy Scenario !Hello everyone!
As I said on my last analysis, we have 2 scenario because of the patterns on the graph (Triangle and Falling Wedge) :
Looks like triangle is more to happen, We have breakout of the support line and neckline of pattern.
We have risky buy from this position with a low SL and high TP, or the safety Buy.
Enjoy it!

JNJ One Last Effort for 180-185?JNJ is currently at the top of the Bollinger bands and as you can see, every time it goes to the top of the band on the daily chart, it usually drifts back down to the 20 SMA. May see a push for 180 as the price action seemed somewhat strong in the morning of 8/20/21, but died off late into the day.
Long overall, bearish in the short term if it doesn't go up on Monday, will probably drift down to 20SMA before resuming. In the case that it does get momentum to pop on Monday, will probably stall in the 180s as it waits for the moving averages to catch up.
My take is that if it trends down, I would enter at 175+
If it trends up, I would do a short term 180 call with targets 181

JNJ reached a very high peakRegarding the stock of Johnson and Johnson, it reached a very high peak, now it is time to go down, and this is based on the relative strength index, as it gives us clear selling signals, which are as follows:
Negative difference
Retest a broken trend
Probability of a harmonic pattern
It is better to wait to reach the level of 61.8 on the rsi and enter into a short position.

Johnson & Johnson Ponzied - CEO Steps Down - STONKLarge cap stonks & crypto Ponzi Pogs collapse. *valuation matters

Johnson & Johnson Stock Daily AnalysisHello everyone, as we all know the market action discounts everything :)
_________________________________Make sure to Like and Follow if you like the idea_________________________________
The Johnson & Johnson stock is having a great Bullish movement right now, In the last week, the stock price has risen from 173.05 and reached 179.47 today. That's more than 3.7% in 1 week.
Both the short-term and long-term trends are positive. This is a very positive sign.
We are looking at 2 different Scenarios for the next period of time :
Scenario 1 :
The price has gone up and reached the resistance zone at 178.51 to 179.17 and its currently above it but it hasn't closed above it yet, That means the market is still moving in a Bullish way but until we have our confirmation we cant say the price is gonna keep going, but all the signs are Bullish After today's candle closes we will have our confirmation and the price will most likely continue his journey up reaching the 180.45 level.
Scenario 2 :
The price has gone up and reached the resistance zone at 178.51 to 179.17, Here the Bears has a Chance to show some control over the market action, The bulls are testing the Bear right now, And if the Bulls were to fail then the bears will take some control and we will see the price dropping from the resistance zone and its gonna be headed near the support line at 176.57, where a Battle will happen between the Bears and the Bulls and the outcome will determine the movement of the stock for the next period of time.
Technical indicators showing this :
1) The Market price is currently trending above the 5 10 20 50 100 and 200 MA and EMA (Bullish sign)
2) The MACD is above the 0 Line showing that the market is in a Bullish state, With a positive crossover between the MACD line and Signal line.
3) The ADX is at 31.68 showing that the market is currently trending, With a positive crossover between DI+ (36.78) and DI- (10.24)
Support & Resistance points :
support Resistance
1) 176.57 1) 178.51
2) 175.29 2) 179.17
3) 174.63 3) 180.45
Fundamental point of view :
JNJ has a Return On Assets of 10.07%. This is amongst the best returns in the industry. The industry average is -32.26%. JNJ outperforms 94% of its industry peers.
The Earnings Per Share has grown by a nice 14.55% over the past year. JNJ has an Altman-Z score of 4.59. This indicates that JNJ is financially healthy and has little risk of bankruptcy at the moment.
Biden administration officials reportedly plan to recommend booster doses of Pfizer and Moderna’s Covid-19 vaccines to most Americans eight months after they received their second dose. This could Affect the Johnson & Johnson stock as other company's Vaccine such as Pfizer and Moderna is being used far more often and being recorded for giving better result than the JNJ Vaccine .
This is my personal opinion done with technical analysis of the market price and research online from fundamental news for The Fundamental point of view, not financial advice.
If you have any questions please ask and have a great day !!
Thank you for reading.

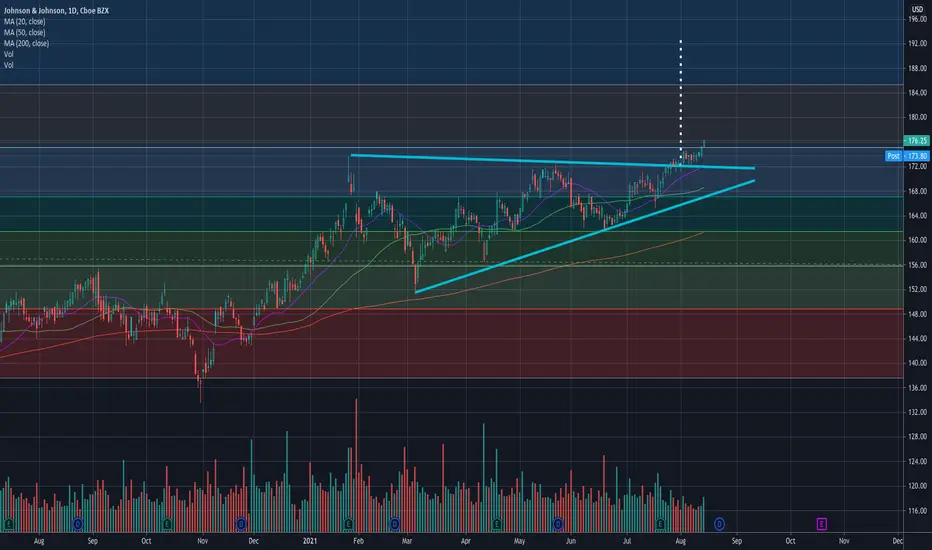
$JNJ - Triangle break out - Target $185The price broke above the triangle passed through prior all time high.
The measured move of the breakout is $195.
Look to take profit around $185.
Good case - $185
Best case - $195
Stop loss - below $172
———————————————————
How to read my charts?
- Matching color trend lines shows the pattern. Sometimes a chart can have multiple patterns. Each pattern will have matching color trend lines.
- The yellow horizontal lines shows support and resistance areas.
- Fib lines also shows support and resistance areas.
- The dotted white lines shows price projection for breakout or breakdown target.
Disclaimer: Do your own DD. Not an investment advice.

JNJ looks promising for a breakoutJNJ looks promising for a breakout. With MRNA vaccines facing increased scrutiny in Europe, JNJ may benefit potentially.

Bullish on JNJJNJ is hovering at it's all time high, forming a cup & handle and just fired off a 'squeeze' (ala John Carter). So, I'm thinking it goes higher...
JNJ


Ascending TriangleLooks like earnings are over but JNJ is struggling at the resistance of the top trendline of the triangle.
An ascending triangle is still a triangle and can break either way.
The ascending triangle is a bullish continuation pattern and is characterized by a rising lower trendline and a flat upper trendline that acts as support. This pattern indicates that buyers are more aggressive than sellers as price continues to make higher lows. The pattern completes itself when price breaks out of the triangle in the direction of the overall trend.
The market should be in an uptrend when the ascending triangle appears. The ascending triangle starts to take on its form as the market enters the consolidation phase. While the market is consolidating, a rising trendline can be drawn by connecting the lows. This ascending trendline shows that buyers are slowly pushing the price up which provides further support for a bullish trading bias. The upper trendline acts as resistance. Price often approaches this level and bounces off until the breakout eventually occurs. After price posts a strong break above the upper trendline, traders will look for confirmation of the pattern via continued upward momentum. A clean break of the trendline with a trend in that direction is advisable before long entry.
Ascending triangles can break to the downside just as descending triangles can break to the upside.
Targets are calculated using the distance of the wide end of the triangle and projected upward from the triangle. Some use the bottom trendline for the projection and I have seen others use the bottom trendline.
You can place a stop somewhere under the triangle or inside where you see support. After a break of the upper trendline, some place the stop under the former top trendline of the triangle.
Price is close to the top bollinger band set on an 80 moving average.
No recommendation
JOHNSON & JOHNSON: DETAILED FUNDAMENTAL+FIBO ANALISY|LONG🔔Johnson & Johnson has been a profitable business to invest in for years. But its legal problems have grown steadily--the company has faced tens of thousands of lawsuits over talc alone.
And while so far the health care giant has managed to cope with its legal costs and remain profitable, that may not be the case in the future.
In addition, all these negative publications are not good for the Johnson & Johnson brand. The constant barrage of recalls and lawsuits could cause real, long-term damage. Can we still invest in this business, or have Johnson & Johnson's legal problems made this company a stock to be avoided at all costs?
Johnson & Johnson has been involved in numerous lawsuits in recent years. Most recently, earlier this month, the company announced a voluntary recall of certain Neutrogena and Aveeno sunscreens. Although benzene, a known carcinogen, is not in their composition, it was found in product testing. Johnson
& Johnson is recalling the products "for reasons of caution."
In addition, the U.S. Food and Drug Administration (FDA) issued a second warning regarding Johnson & Johnson's coronavirus vaccine. It states that the vaccine may increase a person's risk of developing a neurological disorder called Guillain-Barré syndrome. The agency had also previously issued a warning that the vaccine increases the risk of blood clots. (The FDA also issued warnings for Pfizer and Moderna's COVID-19 vaccines, saying they increase the risk of heart inflammation.)
These cases have not caused problems with Johnson & Johnson's financial performance - yet.
In 2020 and 2019, Johnson & Johnson's legal expenses totaled more than $5 billion. However, in each of those years, the company's net income was about $15 billion. And as a percentage of revenue, the company made an 18 percent profit - only slightly less than the 19 percent net income it achieved in 2018. From a purely financial standpoint, the company has yet to feel much of an impact on its bottom line. When Johnson & Johnson released its latest quarterly results on July 21, its earnings for the period ending April 4 looked higher than ever, at more than $6 billion.
But as problems mount, legal costs could rise sharply in the coming years. And rumor has it that the company is looking ahead to potentially limit some of that liability. According to a Reuters report, Johnson & Johnson is considering writing off liabilities related to baby powder talcum powder to a new business and then putting that business under bankruptcy protection. The move would help limit the company's legal liabilities related to the issue.
Johnson & Johnson is an incredibly profitable company, and its stock is the king of dividends you can count on for the foreseeable future - provided, of course, that legal bills don't begin to undermine the company's ability to meet those obligations. At present, that doesn't seem to be a problem.
However, investors should be careful not to rely solely on past performance or on the company's ability to weather the storm. The more problems become known, the more likely the company is to suffer financial losses in one form or another. We have no way of knowing whether a particular straw will be found that will break the camel's back, and it certainly seems unlikely now that Johnson & Johnson will not survive these problems, given its enormous size. But mere survival will not make this company a great investment. There are also intangibles to consider, such as the impact of bad headlines on the company's future and whether it might cause consumers to switch to competing brands. It, combined with potentially rising litigation costs, creates some long-term risk that investors shouldn't just ignore. And if a company is trying to dodge responsibility to consumers who have developed serious health problems related to talcum powder, it could alienate potential investors from an ethical standpoint.
While Johnson & Johnson is doing well right now, there are better options for investors that don't have nearly as much long-term risk.

Johnson and Johnson Analysis! Buy or Sell! The Covid-19 industryHello!
We can see that we have an up movement on the graph but let me show you some things:
- Ascending triangle is on formation (bull signal) and when the price breakout the neckline I am looking for 100% target.
- Falling wedge on formation (sell signal), just in case the price break the trend line, I will follow the price till the nest support and after make a move.
Remember: A trend it's more often continues !
Enjoy!

JNJ intraday ascending triangleJNJ is in a 7-month ascending triangle where we are testing resistance today with another ascending triangle.
Watch for increase in volume for continuation on breakout
entry: 173.22

JNJ Short this is a short play due to the fact they have a lawsuit about to hit. im looking for puts on HH and call the shorts. NYSE:JNJ
