JNJ trade ideas

$JNJ Could be heading for a run soon - Watch outTrump just talked about making a huge buy from JNJ. Potential tweet about it could lead to a run upside.

Sell Chanceentry to sell = if the green zone is broken down
tp1 , tp2 is shown in fig
sl = above the green zone
.......
To receive notifications of entry to the position, join my channel : t.me


$JNJ Johnson & Johnson Bearish Trade SetupThe daily chart for JNJ is potential printing a bearish continuation pattern where traders could look to take advantage of the downside on:
1. A break below 130.35 or,
2. A break below the incline support of the pennant.
A print and close below these levels could see the share test the prior swing lows of $120.96

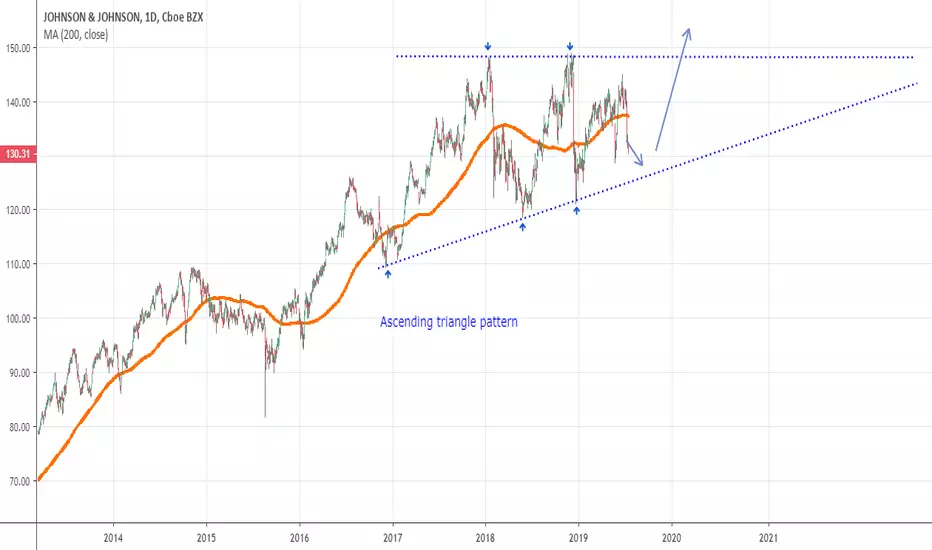
JOHNSON & JOHNSON 1D IS IN A RANGE & BEARISG FLAGBearish Flag is a form of range pattern
Ranges, Descending Triangles, Triangles, & Ascending Triangle are repeatable trading chart patterns.
Triangles and ranges are consolidation chart patterns that can breakout either direction.
Ascending and descending chart patterns will have a directional bias depending on the previous incoming trend.
Each chart pattern will have defining trendlines of the support/resistance levels creating the pattern.
What ever time frame you are trading this chart pattern, wait for a candle close outside of the trendline in the direction of the breakout candle. (Our time frame preference is the Daily chart ).
Add volume indicator - Volume is the amount of $ that went into a particular candle or in Forex the # of trades that took place.
Add ATR indicator - Volatility is the amount of price movement that occurred. Use the ATR to measure the price movement.
When you see descending volume bars and descending atr line (which indicates volatility ) this shows
a dis-interest in traders to invest in this pair creating consolidation which creates the chart pattern.
Trade Management after there is a breakout candle close.
1 - Position size (compare volume bar to volume ma line).
a - Breakout candle must be 100% of average volume for a full position size.
b - If 75% of average volume then ½ position size.
2 - Enter two trades.
3 - SL for both trades will be 1.5 x ATR.
4 - 1st trade TP will be 1 x ATR.
5 - No TP on 2nd trade – letting profit run and adjusting SL to follow price.
6 - When 1st TP hit – move 2nd trade SL to breakeven.
7 - Adjust the 2nd trade SL to follow price.
*8 - When breakout candle is more than 1 ATR from breakout candle open.
a - Enter 1st trade at candle close with ½ position size.
b - Enter 2nd trade with a pending limit order that is 1 ATR of breakout candle open.
c – Price should pullback to that pending limit order for 2nd trade.
d – If Price returns back into chart pattern close trade before SL is hit.

JNJ potential movesIf it forms a head and shoulder that is bearish, if it makes a new high find a good price on way down as the new high is bullish

JNJ 200MA TradeJNJ has bounced off the 200MA. The last two moves pushed slightly through it, hence my entry at 137 for another touch, with a stop of c.1% (135.50) below the MA and parallel channel line, and a modest target of 143, the Sep 18 high, giving a 4:1 trade.
The 2018 price/action below the MA shows this stock does take that indicator into account. Note also a fairly good match to the previous climb.

JNJ Bullish double bottom forming PotentialNice trend line support off the weekly. JNJ looks to be forming a double bottom on the daily. I'll be looking for a break of the neckline with a lower limit to pick up some shares long on JNJ

JNJ Sideways and declineJNJ debit spread 130/120 Put spread 2.53 debit Max profit is 7.47 exp September 20th.
I have a pretty long debit spread on JNJ its a high reward low risk trade.
I think it may continue lower slightly and hit my target which in this case will be $5 on the spread.
If I lose and it rises and stays above 135 etc. I will close the trade on August 30th for a loss and salvage anything that I can.
This is a journal entry and not trading advice.
Double bottom breakdown and sideways movement is my prediction since we're in a bull market it may move higher.


Technical Analysis For J&JASCENDING PATTERN HAVE FOUND IN DAILY CHART IN MY OPINION ITS POSITIVE SIGN FOR LONG.
WE CAN ENTER TRADE AT 149.00
Daily JNJ stock price forecast analysis18-Jul
Price trend forecast timing analysis based on pretiming algorithm of Supply-Demand(S&D) strength.
Investing position: In Falling section of high risk & low profit
S&D strength Trend: About to begin a rebounding trend as a downward trend gradually gives way to slowdown in falling and rises fluctuations
Today's S&D strength Flow: Supply-Demand(S&D) strength flow appropriate to the current trend.
read more: www.pretiming.com
Forecast D+1 Candlestick Color : RED Candlestick
%D+1 Range forecast: 0.5% (HIGH) ~ -0.9% (LOW), -0.3% (CLOSE)
%AVG in case of rising: 1.2% (HIGH) ~ -0.2% (LOW), 0.7% (CLOSE)
%AVG in case of falling: 0.4% (HIGH) ~ -1.4% (LOW), -1.0% (CLOSE)


Potential Buy for JNJ Great potential dip buy opportunity for Johnson and Johnson. Wait for confirmation of higher highs and and higher lows before taking trade. Once it has reversed into an uptrend trend, trade can yield a potential 5-8% return.

Daily JNJ prediction analysis report by Supply-demand strength.03-Jul
Price trend forecast timing analysis based on pretiming algorithm of Supply-Demand(S&D) strength.
Investing position: In Falling section of high risk & low profit
S&D strength Trend: In the midst of a rebounding trend of upward direction box pattern price flow marked by limited falls and upward fluctuations.
Today's S&D strength Flow: Supply-Demand strength has changed to a strengthening buying flow when stock market opening.
read more: www.pretiming.com
D+1 Candlestick Color forecast: RED Candlestick
%D+1 Range forecast: 0.2% (HIGH) ~ -1.0% (LOW), -0.5% (CLOSE)
%AVG in case of rising: 1.2% (HIGH) ~ -0.1% (LOW), 0.7% (CLOSE)
%AVG in case of falling: 0.5% (HIGH) ~ -1.2% (LOW), -0.8% (CLOSE)
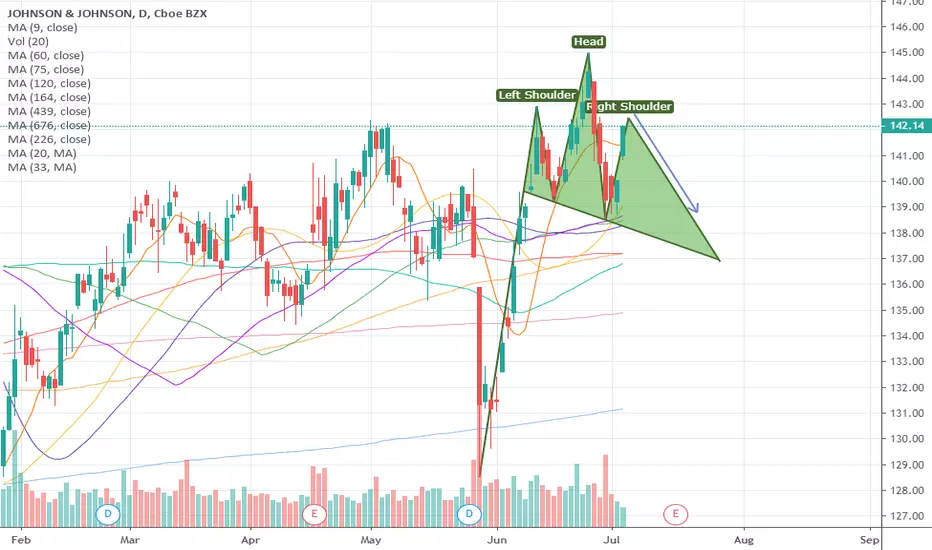

JNJ backtesting the necklineJNJ had broken down from a h&S and almost hit the measured move target 128. now it is back testing the neckline again. let's see how it goes


$JNJ Looks a certain short from here. $120 NEXT STOP*****INVESTORS IN NYSE:JNJ CAN'T WAIT FOR MAY TO BE OVER, ALREADY DOWN 7% AND 5% IN ONE DAY , NEXT SUPPORT IS ANOTHER 6% AWAY AND IT LOOKS VERY MUCH LIKE THAT IS WHERE THE PRICE IS GOING. OPIOID LITIGATIONS CONTINUE TO BE A DRAG ON SENTIMENT AND THAT ISSUE WILL INTENSIFY AS THE CRISIS INTENSIFIES.
AVERAGE ANALYSTS RETAIL PRICE $148
AVERAGE ANALYSTS RECOMMENDATION OVERWEIGHT
P/E RATIO 24
