Eli Lilly and Company (LLY) - A Comprehensive OverviewOverview:
Eli Lilly and Company, a global pharmaceutical leader, is known for its extensive range of human pharmaceuticals. Founded in 1876 and headquartered in Indianapolis, LLY focuses on discovering, developing, and marketing pharmaceuticals worldwide.
Key Financials:
As of December 31, 2022, LLY's total assets stood at $49.49 billion, with a significant portion in current assets ($18.03 billion) and non-current assets ($31.45 billion).
Net sales/revenue saw a steady increase from $24.55 billion in 2018 to $28.54 billion in 2022.
Gross profit also rose from $19.59 billion in 2018 to $23.31 billion in 2022.
Net income displayed notable growth, especially in 2022, with $6.25 billion compared to $3.23 billion in 2018.
LLY’s operating cash flow improved from $5.53 billion in 2018 to $7.08 billion in 2022.
Stock Performance:
The stock price as of November 10, 2023, was $597.71, with a 52-week high of $629.97.
Market Capitalization: $537.5 billion.
The EPS growth was +14.7% from the prior TTM.
Market Position Against Competitors:
LLY’s P/E ratio of 83.1 is significantly higher compared to industry peers like Johnson & Johnson (JNJ), Pfizer Inc. (PFE), Merck & Co Inc (MRK), and Bristol-Myers Squibb Co (BMY), indicating a potentially higher growth expectation from the market.
LLY's Price to Sales ratio is 18.2, showing a premium valuation compared to its competitors.
Revenue growth at +1.5% is moderate compared to industry growth rates.
Investor Sentiment:
The Equity Summary Score for LLY is neutral at 6.3, reflecting a balanced view among analysts.
Analysts’ opinions show a mix of Neutral and Buy, with a significant positive outlook from firms like Jefferies, CSFB, and UBS.
Conclusion:
Eli Lilly and Company, with its strong financials, diverse product portfolio, and robust operational efficiency, remains a key player in the pharmaceutical industry. While it commands a premium valuation compared to its competitors, its consistent growth in key financial metrics, and innovative product pipeline, position it favorably for future growth. Investors and analysts maintain a cautiously optimistic view of the company's prospects in a competitive market.
LLYC trade ideas

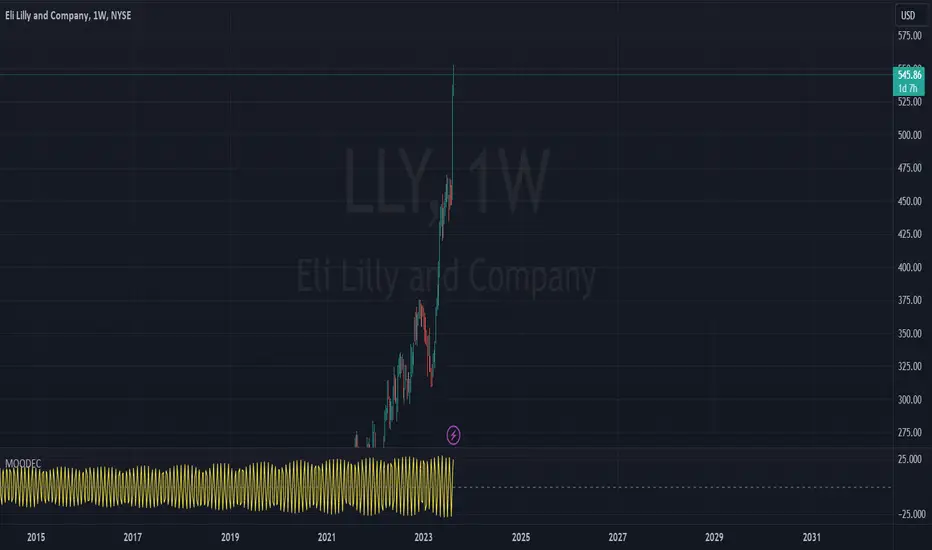
Just Keeps GoingI guess the sky is the limit with LLY.
Earnings received well even though negative on EPS and a EPS miss.
Price appeared to be forming an M pattern but has made another leg up.
Resistance overhead.
No recommendation.
BEWARE of the dog, but that cat can be shady too (o:

Earnings 11-2Earnings does not look as if analysts expect a whole awful lot but you never know!
M pattern that could take this lower. Peak 2 is higher than peak 1 so possibly looking at a Shark (to the .886 or the 1.113 or a Cypher (to the .786 and measured from entire structure and the Shark is measured from the 1st peak) This could also be a NEN-Star (takes it to the 1.272.) and I will not venture a guess at this time.
Bearish RSI divergence (purple line).
Looks to me like this party will end within a few weeks but who knows. Possibly a 2nd shoulder will form wile folks run for the life boat. );
No recommendation
52 Week Range
302.14
629.97
Day Range
556.64
570.81
EPS (FWD)
8.24
PE (FWD)
68.03
Div Rate (FWD)
$4.52
Yield (FWD)
0.81%
Short Interest
0.71%
Market Cap
$503.81B
Volume
2,717,360

LLY Bearish Confirmation Put in at the 3.618 Fibonacci ExtensionLLY has given us Bearish RSI Confirmation at the 3.618 Fibonacci Extension and now looks to push below the $580 level. This could quickly devolve into LLY making a much deeper Bearish Retrace that would bring it below trend. At that point, we could very well see LLY come all the way back down to fill the gap at $163.42

ELI LILLY Next bullish phase starts. Target 670.Eli Lilly / LLY stopped its short term decline yesterday a little over the 1day MA50.
The green 1day candle signals the start of the new bullish phase inside this double Channel Up.
The 1day RSI is on a similar pattern as August 3rd.
Assuming a declining rate of growth on each Higher High, buy and target 670 (+30% from the recent bottom).
Follow us, like the idea and leave a comment below!!

Eli Lilly Sues Online Pharmacy To Ban US Imports Of Fake drugs Eli Lilly sues online pharmacies to ban US imports of fake Mounjaro.
Eli Lilly on Thursday said it sued 11 online pharmacies to stop them from importing, selling and distributing products claiming to contain the active ingredient in its diabetes drug Mounjaro, which is expected to be approved for weight loss later this year.
The Indianapolis-based drugmaker said the suit will go to the U.S. International Trade Commission (ITC).
It names the U.S.-based Artic Peptides, Strate Labs, Supopeptide, The Triggered Brand, and Unewlife as defendants, along with Britain’s Biolabshop, Spain’s Super Human Store and Steroide Kaufen in Poland. China’s Audrey Beauty, Mew Mews Company and AustroPeptide were also targeted in the complaint.
Lilly said testing of AustroPeptide’s product purporting to contain the Mounjaro main ingredient tirzepatide showed it actually was “nothing more than sugar alcohol.”
The U.S. ITC has the power issue import bans against products that violate certain parts of U.S. trade law and to take them off the market once they have entered the country.
Once the complaint is published in the Federal Register, the commission will have 30 days to decide whether to accept it or not.
Lilly is accusing the online pharmacies of infringing its trademark for Mounjaro, falsely associating themselves with Lilly and approved tirzepatide, and making false or misleading statements in their advertisements related to tirzepatide.
“The unapproved drug products are dangerous research chemicals that are not approved for human consumption and have no connection to Eli Lilly or Mounjaro,” Lilly said in its lawsuit.
Lilly is the only company with U.S. Food and Drug Administration approval to sell tirzepatide products.

Weight loss - Stock GainEli Lilly & Co. is a pharmaceutical company with a long history dating back to its founding by Eli Lilly in May 1876. The company is headquartered in Indianapolis, Indiana, and is engaged in the discovery, development, manufacture, and sale of pharmaceutical products. Their product portfolio includes a range of therapies in various therapeutic areas, such as diabetes, oncology, immunology, neuroscience, and other medical conditions.
One notable aspect of their recent success is the introduction of a weight loss drug, tirzepatide. This drug is similar to other medications like Ozempic and Wegovy, which are also designed to help with weight loss. These medications are administered via weekly injections and work by affecting the patient's appetite by mimicking certain hormones in the gut.
Wegovy, for instance, primarily mimics the hunger-regulating hormone called GLP-1, while tirzepatide goes a step further by mimicking both GLP-1 and another hormone called GIP. These hormonal effects can lead to decreased appetite, making it easier for individuals to manage their weight.

ELI LILLY Our gem on the verge of making a paradigm shift.Eli Lilly and Company (LLY) has long been one of our best investments a real gem that even withstood and was practically unaffected by the 2022 inflation crisis. For long we have been using the Fibonacci Channel to display LLY's parabolic nature having broken above the 2.0 Fibonacci extension last May.
This time the price reversed much quicker than technically expected and is attempting again to break the top (Higher Lows trend-line) of the Channel Up that started in 2020. If it closes above it, then we wil target the 3.0 Fibonacci Channel extension at $700. If it gets rejected and stays within the Channel Up, we will sell and target the recent Support at $520.
Note that a break above this 3-year Channel Up may constitute a paradigm shift as the stock has never hit a new upper Fibonacci level that quickly (remember it broke above the 2.0 Fib just 5 months ago). This can transcend LLY into an even more aggressive bullish nature that we can't yet quantify.
-------------------------------------------------------------------------------
** Please LIKE 👍, FOLLOW ✅, SHARE 🙌 and COMMENT ✍ if you enjoy this idea! Also share your ideas and charts in the comments section below! This is best way to keep it relevant, support us, keep the content here free and allow the idea to reach as many people as possible. **
-------------------------------------------------------------------------------
💸💸💸💸💸💸
👇 👇 👇 👇 👇 👇

LLY Bubble May Be FinishedHello friends.
Eli Lilly has been catapulted into an extraordinary bubble, spurred on by the narrative of their weight loss drug being taken up by America's obese population. The price just seems to go up and up forever, and many traders likely think that it will go to infinity. But all bubbles must pop at some point, and we think that it's the perfect time for the Eli Lilly bubble to come to an end right about now.
We have found that one of the best ways to get in on the collapse of a bubble is not to short the pico-top, but rather to have some patience, and wait for a peak followed by a sharp impulsive looking movement to the downside, and then a corrective pullback to that move. Finally, we can short. This is what Eli Lilly looks like right now for us. According to our view of the wave count, we could expect an impulsive wave 3 downwards, which would be a very big and volatile move down. As a result, the best way of trading this is to buy puts on LLY expiring in around 45 days. It's a risky trade that could get wiped out entirely, or could make a huge profit. We will see!
Thanks for playing.

ELI LILLY Needs to correct a little more. Massive buy after.Eli Lilly has completed 3 red weeks in a row. The parabolic rise it is seeing for years is seen accurately on this Fibonacci Channel.
Every such price peak, pulled back to under the MA100 (1d), which is now at 492.43, in order to gather buyers.
Trading Plan:
1. Sell on the current market price.
Targets:
1. 490 (between the MA100 (1d) and the Fibonacci 2.0 level.
Tips:
1. The MACD (1d) is just formed a Sell Cross. Only once since 2018 has a Sell Cross failed to deliver a sizeable drop.
Please like, follow and comment!!

ELI LILLY: Possible to start a strong multi week correction.Eli Lilly has seen enormous growth over the past few years and in particularly in 2023. This Channel Up on the log chart's 1W timeframe is the best depiction of the long term trend. The 1W outlook got extremely overbought technically three weeks ago (RSI = 68.989, MACD = 46.590, ADX = 60.019) and is now correcting. The rejection took place at the top of the Channel Up.
This is a hint that investors should be exiting LLY and not entering. Historically the most efficient level to buy is on the 1W MA50 with a max extension to the 1W MA100. That is our entry strategy. Don't take chances and take the best possible entry. This stock will reward us enormously in 2024.
## If you like our free content follow our profile to get more daily ideas. ##
## Comments and likes are greatly appreciated. ##

LLY, This ALL-TIME-HIGH ROCKET is a NEVER ENDING STORY!Hello There!
Welcome to my new analysis about LLY on several timeframe perspectives. LLY printed an major bullish breakout literally over night bouncing out of the range. In the recent times the pharma industry transformed into a eager bullish environment since the gains seen because of the "pandemic" and LLY is a stock already present since 1978 in the 19th century, a time before the great depression. The FED is considering a more dovish policy as inflationary pressures in the U.S. decreased and LLY showed an development typical for more bullish stocks within the market, it already bounced before the U.S. CPI release signaled an easing in inflation, such moves are always important to anticipate as it is the case with LLY and the long direction.
Within the chart LLY is now forming a flag-formation on the local term which is likely to complete with a breakout in the near future setting up the next wave C extension into the upper directions. On the global term LLY bounced several times within the ascending trendline and has an underlying strong volatility-spike structure which is bolstering the bullish sentiment here. Once LLY has shown up with the breakout dynamics and reached the targets of the local formation this is likely to convert into the continuation of the global trend as well. Currently, the bullish scenario should be considered if the FED does not become more hawkish on interest rates or there is a major demand shortage increasing supply within the pharma market this should be a considerable scenario for the next times.
In this manner, thank you everybody for watching, support is greatly appreciated, all the best!
VP

ELI LILLY Hit the top of the 4-year Channel. Relief sell-off?Earlier this year we gave a strong buy signal on Eli Lilly and Company (LLY) on March 01 (see chart below) where we called for the most optimal buy entry exactly at the bottom of the bullish pattern:
The price has now hit (last week) the top of the 4 year logarithmic Channel Up, highly overbought with the RSI on the 1W time-frame reaching 84.30, breaking above the August 16 2021 High. As last week's 1W candle closed in red (the first after 5 straight bullish weeks) this is considered so far a Higher Highs rejection and calls for an early sell signals towards the end of October, targeting the 1D MA100 (red trend-line) at $500.00, where the stock will start turning into a buy opportunity again (assuming the RSI is below 55.00).
-------------------------------------------------------------------------------
** Please LIKE 👍, FOLLOW ✅, SHARE 🙌 and COMMENT ✍ if you enjoy this idea! Also share your ideas and charts in the comments section below! **
-------------------------------------------------------------------------------
💸💸💸💸💸💸
👇 👇 👇 👇 👇 👇

$LLY, Price correction?Eli Lilly and Company discovers, develops, and markets human pharmaceuticals worldwide.
Positive:
Yields high return on invested capital
Has raised its dividend for 8 consecutive years
13 analysts have revised their earnings upwards for the upcoming period
Prominent player in the Pharmaceuticals industry
Cash flows can sufficiently cover interest payments
High return over the last year
An analyst from Morgan Stanley maintained Eli Lilly (NYSE: LLY) at 'overweight' with a price target of $640.00 from a prior price target of $617.00.
Negative:
Trading at a high earnings multiple
Corporate insiders Sold shares worth $21.3B in the past 3 months
Hedge funds Sold 789.5K shares in the past quarter
Very strong bullish trend, it is expecting a price correction after this stock should follow

LLY: The NVDA of Pharmaceuticals Showing Signs of Future DeclineIf we close the day as we are now, we will have confirmed a 3 Line Strike, a Bearish PPO Arrow, and a break below the 5 EMA on the Daily Timeframe just above the 3.618 Fibonacci Extension. From there I would expect LLY to first Fill the gap at $451.50 and beyond that I think it will revisit the 200-day SMA around $350 and maybe even the 800-day EMA at around $285.

BYE BYE $LLYRising wedge on the daily with the MACD and RSI headed to the downside. This is looking ready to break to the downside.
Price target range: $535-540

More Absurdity1) Ridiculously overvalued.
2) Coiled stochastics monthly.
3) Overbought on all timeframes.
4) Heavy institutional ownership.
5) Log chart shows channel. Linear chart shows extreme price deviation.
It can always go higher, as human stupidity is boundless, so just saying.

Eli Lily Local Top, Continuation Will ReturnEli Lilly and Company is an American pharmaceutical company headquartered in Indianapolis, Indiana, with offices in 18 countries. Its products are sold in approximately 125 countries. The company was founded in 1876 by, and named after, Colonel Eli Lilly, a pharmaceutical chemist and veteran of the American Civil War

ELI LILLY Approaching the top of the Channel. Sell opportunity.Last time we looked at Eli Lilly and Company (LLY) was on March 01 (see chart below) where we called for the most optimal buy entry exactly at the bottom of the bullish pattern:
The price is now approaching the top of the 3 year logarithmic Channel Up, highly overbought with the RSI on the 1W time-frame at 80.00. This gradually calls for a sell towards the end of August, targeting the 1D MA100 (red trend-line) at $480.00, where the stock will turn into a buy opportunity again.
-------------------------------------------------------------------------------
** Please LIKE 👍, FOLLOW ✅, SHARE 🙌 and COMMENT ✍ if you enjoy this idea! Also share your ideas and charts in the comments section below! **
-------------------------------------------------------------------------------
💸💸💸💸💸💸
👇 👇 👇 👇 👇 👇

LLY Earnings Play LONG ( Flat Bottom Triangle Breakout)My analysis is on the 2H. I am uniquely qualified in my fundamental analysis. This is a one
day until earnings. My thesis is the earnings will stimulate what will be a breakout from
a flat bottom triangle. I will buy one share of stock. I will spend a similar amount on
call options striking $460 expiring August 11th. I see LLY as surging while PFE is a bit
challenged with the fall off in Covid vaccine work. If you find this idea interesting and
might appreciate my ideas as to a stop loss and targets, leave a comment. Like and
subscribe. Trade well !

LLY Eli Lilly Options Ahead of EarningsAnalyzing the options chain and the chart patterns of LLY Eli Lilly prior to the earnings report this week,
I would consider purchasing the 450usd strike price Calls with
an expiration date of 2023-8-11,
for a premium of approximately $11.70.
If these options prove to be profitable prior to the earnings release, I would sell at least half of them.
Looking forward to read your opinion about it.

LDMR (Long Derivative Mean Reversion)(LDMR)Long Derivative Mean Reversion is primarily a tool for measuring risk and capital efficiency.
It's secondary functions include identify outliers in the assignment value of derivatives, maintaining a price target and producing trade placement recommendations.
This strategy has one simple input: the symbol of a correlated asset or index. It is recommended to use leveraged indexes in this input because they have a higher derivative correlation with those of round lots of the underlying.
When using this strategy you should always adjust the initial capital to what it will cost you to control 100 shares of the security.
If you intend to purchase shares then that value is 100x the close price.
if you intend to purchase call options to resell for premiums you use the initial premiums paid for the calculation.
If you intend to create a synthetic position you should add all deployed capital together, and that calculation will remain accurate until the max profit limit of your short option is reached.
Pyramiding is supported for trade placement. You should always review the historical depth and before placing the first trade ensure you have enough capital to cover the largest of those positions. Otherwise your results may be entirely incomparable to the risk and capital efficiency estimates the tool provides.
Let me know what you think. I am considering a private publishing and want to know what this is worth!
