Possible Bullish Swing Trade on LVSLVS is pulling back, looking for a bounce around $53. If it does will look to initiate a bullish swing trade.
LVSC trade ideas

LVS is not done droppingHistorically when VI reaches this level the LVS drops at least another 1%. The average drop is 13.13% with a minimum historical drop of 1.81%.
The support line in the current trend channel would equate to roughly a 6% drop over the next few weeks. I am conservatively forecasting a drop to the 52.45 level which is roughly 3.23% from the close on December 27.

More bad news for LVSA fourth indicator of a drop is based on historical levels for the Coppock Curve. LVS drops on average 11.05% when the Coppock Curve reaches its current mark. My conservative play at this point is a drop to the psychological 49.50 mark. This would bring in around 9% for the stock, but could bring in well over 75% on a properly placed PUT option.

Possible LVS Bearish tradeLVS faded on Thursday, Gapped up on Friday above resistance but also faded (possible dead cat bounce).
Will watch this week to see if LVS retests resistance and pushes through or rolls over and heads lower.

Third indicator of imminent LVS dropMany historical indicators are at play and against the short term for LVS. When the TSI reaches this level is stock drops at least another 1% but drops on average 9.14% over the next few weeks. I have outlined 3 potential points LVS could drop to.
CONSERVATIVE POINT:
With the average drop around 9.14%, an even 9% drop would be around the 51.88 mark and it is within the current trendchannel.
ESTIMATED BOTTOM OF TRENDCHANNEL AFTER NEW YEAR:
The estimated bottom of the trendchannel within the next few weeks is around the 50.50 mark which roughly equates to a 11.42% decline.
PRIOR 2015 INTEREST RATE HIKE DROP:
When interest rates were increased in December 2015, LVS dropped around 20.22% from the OPEN the day after the decision to the bottom before it turned around. This bottom is the current bottom line of the trendchannel, however, a similar 20% drop would bust out of the current trend. Although movement of this nature is most likely not going to be as drastic, nothing can be ruled out.

More bumps in LVS roadHistorically when this indicator surpasses this level, the stock declines by at least 1%. The average decline is 10.85%. There are many fundamentals in play with this technical indicator that will support a decline.
There are three levels to watch, my play is always the most conservative one.
CONSERVATIVE:
A simple 6% drop to around the low from Dec 8 over the next few weeks.
HISTORICAL AVG:
For historical drops, I try to chose a conservative milestone. Even though the average drop is more than 10%, A safe play is a drop to the 52.10 level.
LAST INTEREST RATE INCREASE:
Last time interest rates increased. LVS dropped more than 22% in only 10 trading days! That was exactly two weeks about a year ago. Unsure what the reaction will be this time around since most pundits agree a interest rate increase is not built in to the recent BULL market boost. The stock could drop another 22%, but my conservative play is to the psychological milestone of 48.00.

MORE DOWN DAYS TO COME FOR LVSHistorically when LVS surpasses this RSI level, the stock drops at least one more percent over the next few weeks. In fact the minimal drop is 2.93% with an average drop of 6.17%. The bottom of the trend channel is well beyond the 6% but my conservative play is a drop to the 53 milestone which would net around 3% and most likely around 30% with a PUT option.
Historically singular large drops for LVS are not isolated incidents and the stock continues downward in the immediate days following a shock drop like the one that occurred on Dec 8, 16.


LVSLVS had a strong close today, so tomorrow morning I'll be looking for follow through momentum with a breakout above $51


$LVS showing signs of accumulation. LVS is a great review of accumulation, markup, distribution, and markdown cycles. Price action looks like we are seeing some accumulation. Recommend remaining CAUTIOUS on an entry as supply or selling demand looks to be present. If shares are not controlled by "strong hands" we may still see some volatility to shake "weak hands."
Add LVS to your watchlist

LVS Day Trade Retest Gap (Brad Reed May15,2015)If LVS opens below 50.86 consider using the Retest Gap strategy. To get a free and complete stock trading education go to www.RealLifeTrading.com

LVSNotes on chart. Looks like a Butterfly - like the coincidence of .50 retrace of high to low move.

LVS - Las Vegas Sands - Daily - Lower End of Valuation RangeI like LVS here now on the long side after many short-side trades over the past year.
I think the pictures of rising revenues, rising margins, declining shares outstanding and a stock that is in the bottom end of its valuation range appears quite attractive. With a dividend yield in excess of 4% as well, it will attract yield hungry investors which will keep support under the stock.
Earnings are already out of the way and the shares are pulling back to their key hidden support level (not shown) from the last quarter.
You can also see that LVS appears to be in a strong downtrend technically from the highs near $90 early last year, but that is what can make an attractive entry: It looks so bad on the charts that there is no one left to sell, and perhaps people are heavily short the stock too. That can only help if any positive news is ever reported.
Upside potential is to the 4.0 times sales level or up 30% from here (3.09 times sales now). Downside risk is under the lows in case something unknown comes into the equation that we haven't anticipated.
Cheers.
Tim 7:32PM Wednesday, February 25, 2015 56.30 last LVS

LVS short based on 60 min 3rd try and daily/weekly traingle patttinyurl.com swing odds for run to 50 area with full explanation with chart


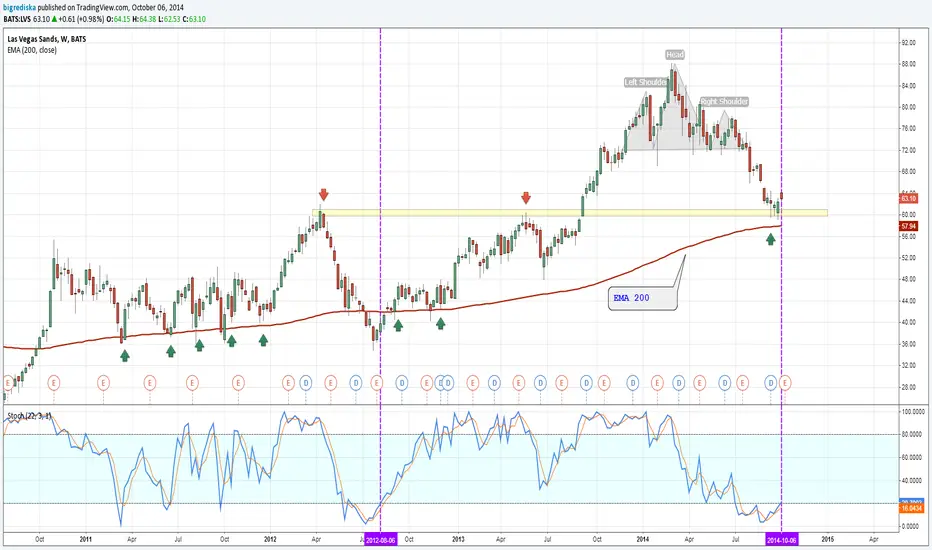
LVS - Same Sell Signal Republishing older chart with some new annotations. Same short signal as the last two charts posted (both hit their targets). Once again faces significant resistance at the 63 RSI level. As highlighted, LVS has bounced off that level 7 times since April, and trended lower each time. Significant gap & TL resistance also above. Entry at $64.45, targeting $62.25 and $60 - 1/2 position on each.
10.17.14 - 1:45pm EST

Las Vegas Sands - LVS - Daily - Rebound to old resistance levelRally to old resistance level / gap / seller level
Target:
Stop:
What do you think?
Tim 64.71 last