MARA Is Waking Up And Looks Promising For The Crypto MarketMARA Is Waking Up And Looks Promising For The Crypto Market, as it can send the price even higher this year from a technical and Elliott wave perspective.
Marathon Digital Holdings with ticker MARA nicely and sharply recovered away from the strong support after a completed projected higher degree abc correction in wave B/2. So, similar as Crypto market, even MARA can be forming a bullish setup with waves »i« and »ii« that can soon extend the rally within wave »iii« of a five-wave bullish cycle within higher degree wave C or 3, especially if breaks above 21 first bullish evidence level. It could be easily supportive for the Crypto market if we consider a positive correlation.
MARA trade ideas

MARA: shoulders done, now walk toward the targetOn the daily chart, MARA completed a textbook inverse Head & Shoulders reversal with a clear breakout above the descending trendline. A corrective pullback followed, and the price is now heading into the key buy zone at 15.21–15.77 - aligning with the 0.72 and 0.79 Fibonacci retracements, and the upper boundary of the broken channel. This is the area to watch for a potential continuation of the bullish impulse.
Volume on the breakout was above average, confirming strong buyer interest. The EMAs are trending below the price, supporting the upward structure. The first target is located at 21.57 (previous resistance), with a potential extension to 28.77 (Fibonacci 1.618).
Fundamentally, MARA remains highly correlated with BTC and crypto sentiment. As interest returns to crypto-related assets due to ETF flows and possible Fed easing, mining stocks like MARA gain attention. Recent reports also show improved production efficiency and lowered costs - a tailwind for bulls.
Tactically, the best setup would be a confirmed reaction from the buy zone — whether a strong candlestick formation, volume surge, or reclaim of a key level. If that happens, aiming for 21.57 and 28.77 becomes a solid plan.
The pattern played out - now it's time for the market to walk the talk.

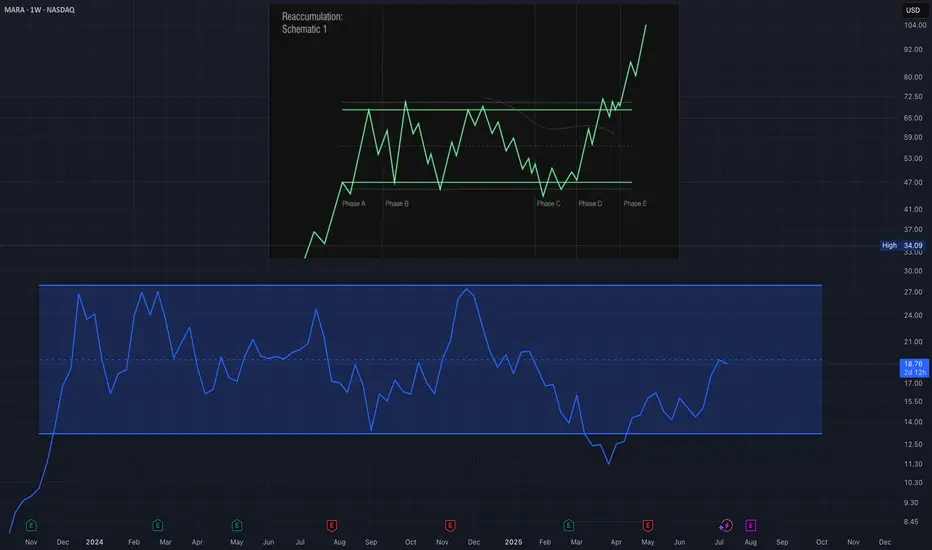
MARA Showing Classic Wyckoff Reaccumulation SetupI’m currently observing what appears to be a Wyckoff Reaccumulation Schematic developing in MARA (Marathon Digital Holdings). After a significant decline, the price seems to have found a floor with a clear Selling Climax (SC), followed by an Automatic Rally (AR) that established the upper boundary of the trading range. The price action since then has remained largely within this range, showing multiple Secondary Tests (ST) that confirm both support and resistance levels. The structure and volume behavior suggest that MARA is likely in Phase C of the Wyckoff reaccumulation process, where we typically anticipate a spring or shakeout to test supply before the next leg higher. If the schematic continues to unfold according to the Wyckoff method, we could see signs of Phase D soon, which would involve a successful test of the spring and a rally back toward resistance with increasing demand. This would set the stage for a potential breakout, marking the beginning of Phase E. I’m closely watching price behavior near the lower range, along with volume confirmation, to validate this scenario. While the structure is still developing, the current formation is consistent with historical reaccumulation patterns seen prior to bullish continuations.
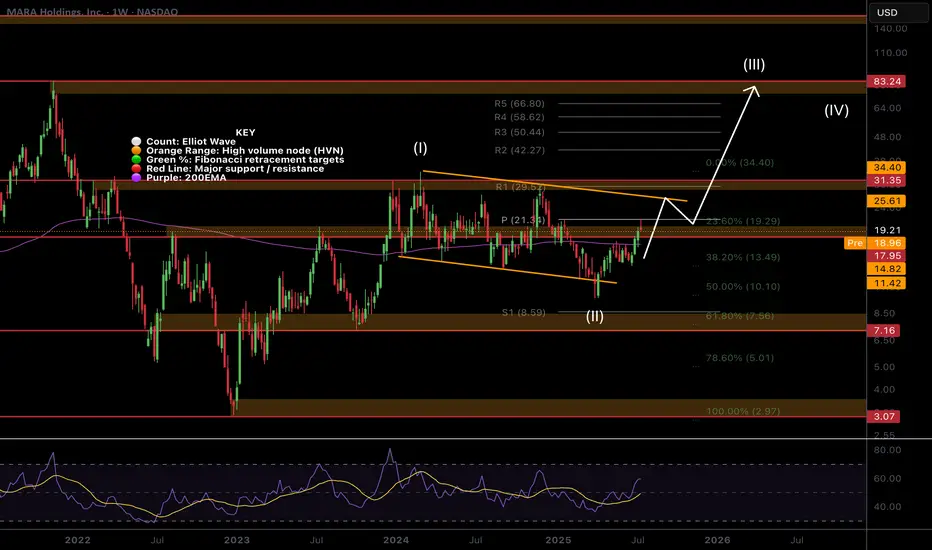
$MARA Hits the Weekly PivotNASDAQ:MARA path has been grinding higher clearing the High Volume Node (HVN) resistance where it is sat as support.
The weekly pivot rejected price perfectly so far but if the count is correct and Bitcoin doesn't dump I expect this continue strongly towards the descending orange line resistance as my partial take profit target.
Once that line is broken i am looking at terminal bull market targets of $80 but will of course take profit at key areas along the way.
Wave 2 swung below the descending support and recovered at 0.5 Fibonacci retracement potentially kicking off wave 3.
Safe trading
MARA supply and demand; swing tradeI'm looking at the weekly chart here, we have an interesting zone between 14.00$ and 14.68$. We've had decent amount of price action correlating to the areas going back to December of 2020. I set my trade idea with a stop loss at 12.95$ just in case of a liquidity flush , we're still getting at least a 3.5 to 1 ratio, with 2 other targets. This could take till May 2026 to conclude, would consider this a swing trade so could take months or more.

Why MARA Stock Could Rally Now as Bitcoin Eyes Its Next Leg UpWith Bitcoin regaining momentum, MARA Holdings (MARA) is showing technical signs that could signal a strong rally ahead. Here’s why the chart supports a bullish case:
1. Bullish Technical Breakout
Golden Cross Signal: On the 15-minute chart, MARA has just seen its shorter-term moving average (blue) cross above the longer-term moving average (yellow), highlighted by the red circle. This “golden cross” is often seen as a bullish momentum signal, indicating a potential trend reversal to the upside.
Strong Volume: The recent surge is accompanied by a spike in green volume bars, confirming strong buying interest and supporting the breakout.
2. Clear Upside Target
Target Set at $17.50: The chart highlights a target price of $17.50, which represents a significant upside from the current level around $14.95. This target aligns with previous resistance and could be reached quickly if momentum continues.
3. Bitcoin’s Influence
Crypto Correlation: MARA is highly sensitive to Bitcoin’s price movements. With BTC back on track and showing signs of starting its next leg up, MARA typically amplifies those moves, often rallying harder than Bitcoin itself.
4. Momentum Shift
Breaking Above Resistance: MARA has broken above short-term resistance levels and key moving averages, shifting the momentum from bearish to bullish in the short term.
Room to Run: The next major resistance is near the $16.50–$17.50 zone, giving the stock room for a continued rally if buying pressure persists.
Bottom Line:
MARA’s chart is flashing bullish signals just as Bitcoin is setting up for another potential rally. With a technical breakout, strong volume, and a clear upside target, MARA could be poised for a significant move higher if the crypto market continues to recover.

$MARA at Resistance!NASDAQ:MARA continues its rally and has come into the High Volume Node resistance target and R2 daily pivot.
Daily 200EMA was tested as support after price smashed through. I expect continuation to the upside $24 target at the R5 daily pivot after some consolidation at this resistance.
Analysis is invalidated way below wave 2 at $13
Safe trading

Trade Idea: MARA (Marathon Digital) - High-Probability Breakout📈 Ticker: MARA (Nasdaq)
💰 Entry: $17.28 (pullback to support)
🛑 Stop Loss: $14.03 (below swing low)
🎯 Take Profit: $24.05 (next resistance + Fib extension)
🔢 Risk/Reward Ratio: 3:1
🔍 Technical Setup
✅ Trend: Strong daily uptrend (higher highs & higher lows)
✅ Support/Resistance:
Entry: $17.28 (near 20-day EMA & previous breakout zone)
TP: $24.05 (1.618 Fib extension + prior resistance)
✅ RSI (14): ~60 (neutral, room for upside)
✅ Volume: Rising on up-moves, confirming bullish momentum
✅ MACD: Bullish crossover on daily chart
🎯 Why This Trade?
1️⃣ Strong Uptrend: MARA is in a clear bullish phase with institutional interest.
2️⃣ Optimal Entry: Pullback to $17.28 offers low-risk entry near dynamic support (EMA 20).
3️⃣ High Reward Potential: TP at $24.05 (39% upside) with tight risk (SL at -18.8%).
4️⃣ Bitcoin Correlation: MARA often follows BTC’s momentum (bullish BTC = bullish MARA).
⚠️ Risk Management
Stop Loss: Hard stop at $14.03 (below recent swing low).
Position Size: Risk only 1-2% of capital (adjust shares accordingly).
Trailing Stop: Move SL to breakeven if MARA hits $20.00.
📅 Timeframe & Strategy
⏳ Holding Period: 2-6 weeks (swing to position trade)
📊 Ideal Scenario:
Holds $17.28 support and pushes toward $20, then $24.05.
Volume expansion on breakout = confirmation.
❌ Invalidation Criteria
Close below $14.03 = exit (break of structure).
Loss of 20-day EMA + declining volume = caution.
📌 Final Thoughts
MARA offers a high-reward swing trade with a 3:1 R/R ratio. The setup aligns with:
Bitcoin’s bullish sentiment (if BTC holds $60K).
Strong technicals (EMA support, RSI not overbought).
🔥 Like & Follow if you agree! Would you enter this trade? Comment below! 👇
#MARA #Bitcoin #Stocks #Trading #Crypto #Breakout #SwingTrading
(Disclaimer: Not financial advice. Trade at your own risk.)

Rising wedge with bearish divergenceI can see Whales unloading on the 2hr chart, with peak volatility, and rsi stalling. Im break the trade down over several charts..

"MINORITY" Report.. Miners making a move.. Often = "delayed" BTCCheck 1Y big picture.
BTC miners making their moves, interesting to see how they compare to each other.
Those 4 a picked for a reason: top 4 performers.
Interesting to see:
IREN @ RIOT topped 70-100%
MARA & CLSK still got "room" to run..
NFA but quite possibly not late to catch a train..

MARA - Trade Both Sides To WinMARA
Similar to Bitcoin , MARA bounced from a 1:1 extension:
And so a 3 wave correction completed in symmetry.
So on MARA chart , from April lows we have;
- A weak 1:0.618 (GW) 3 wave upside bounce (blue line).
- A shallow and descending 1:1 3 wave correction (yellow line).
- And a 0.5 retracement bounce.
The bounce is weaker than Bitcoin and overall the chart looks weak also considering the 1:0.618 extension ~ weak because the third wave is shorter and a sign of waning momentum.
If Bitcoin will at some point move on up then there is a possibility that this 3 wave correction is a connecting and momentum shifting Pattern Separation from the bearish 1:0.618 wave up, into a more bullish future wave up.
But overall the chart looks weak to my eyes.
I am going to somewhat play both sides here because Bitcoin is printing upside liquidity sweeping action.
This signals some sort of downside in the pipeline.
...
In this area I do not yet have too much idea whether the Bitcoin bounce has real impetus or it is an unstable short squeeze that would lead to impulsive downside.
But I do think that some downside is coming; either a pull back or the dominant trend continuing down.
And so this is my opportunity to take the short term signal to get in early on a MARA short.
...
If MARA is weak compared to Bitcoin and Bitcoin grinds higher, there is a reasonable chance that MARA will start falling.
But another significant consideration is that Nasdaq made a new ATH today ~ MARA is part of the Nasdaq index.
Since Nasdaq has tapped into higher liquidity above previous ATH, there is a reasonable chance that Nasdaq will not be making much more significant Y axis discovery to the upside.
And so; similar to the relationship with Bitcoin; if Nasdaq grinds higher and MARA is weak comparing to Nasdaq, then MARA may start falling away.
With both Bitcoin and Nasdaq potentially in some sort of distributive (topping) territory and a potential MARA having a weak relationship with both, in the most bearish scenario MARA may capitulate down and down from here.
And in the more bullish scenario I may make a small loss or perhaps breakeven.
So I bought a few short positions here 👍.
This analysis is shared for educational purposes only and does not constitute financial advice. Please conduct your own research before making any trading decisions.

MARA - Elliott Wave CountThis is my personal MARA EW count, on the monthly timeframe.
Looks bullish and promising, we'll see...

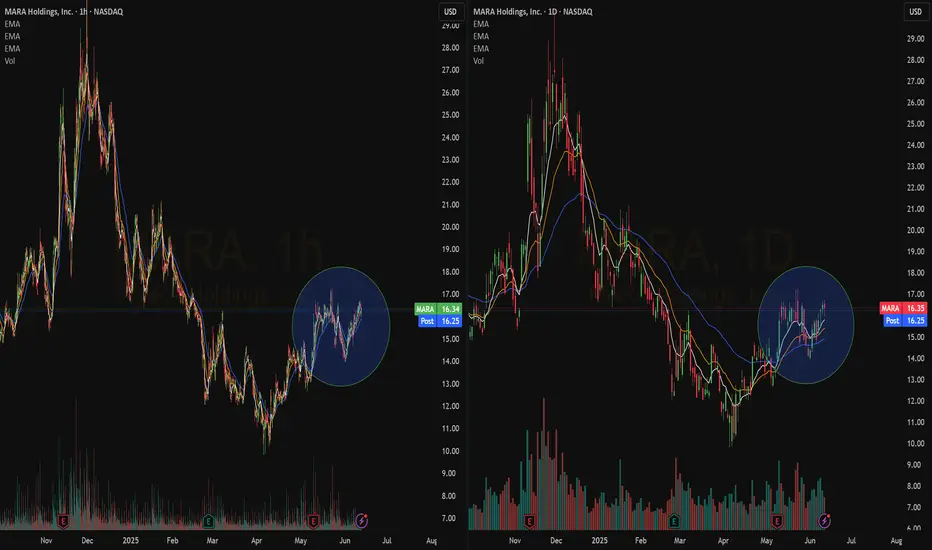
Quick View: $MARADaily -> Bullish crossover with pullback on the ema 50
Hourly-> Consolidated bullish trend
Watching for a #TopSwing Setup on the Daily Chart
Mara Holdings, Inc. —122 2025 New All-Time HighUltra-bullish with new all-time high in sight, MARA hit the lowest price in April 2025 since November 2023.
Good evening my fellow reader, are you a stock trader?
MARA is preparing for a major rise and this opens up an easy trade. A LONG trade.
Needless to say, a "cryptocurrency mining company" is bullish as the Cryptocurrency market turns bullish. No bull market since 2021 and the chart is perfect for a new all-time high.
The previous bull market lasted 602 days and produced 23,593.92% total growth. This time the growth won't be the same, there is nothing like the first bull market, but it will still be very strong. It is likely that the MARA stock will hit all three targets on this chart (49, 73 and 97) and go beyond.
A new all-time high can be 97 followed by 122. I think these levels can be hit easily as part of the bull market bull run. Months and months of continued growth will produce so much bullish momentum that prices will go off the chart.
Namaste.

MARA, has potential upside of roughly 180%.With cryptocurrencies on the brink of a powerful rally, now is an ideal time to initiate a position in Marathon Digital Holdings (NASDAQ: MARA), which we project has upside potential of approximately 180%. As Bitcoin and other digital assets regain momentum, demand for large-scale mining capacity will surge—and Marathon, one of the industry’s fastest-growing publicly traded miners, is perfectly positioned to capitalize. With its expanding fleet of high-efficiency rigs and access to low-cost, renewable energy contracts, Marathon is set to dramatically increase daily BTC production. Moreover, the company’s disciplined balance sheet management and strategic partnerships in infrastructure development underpin its ability to scale profitably. In short, riding the next crypto bull run through Marathon stock offers targeted exposure to the profit-leveraged side of digital-asset issuance and mining economics.

$MARA - $30 Call Option for September 19, 2025Enter close to the trend retest, stop loss behind the trend line, profit targets at support, gap, or Fibonacci levels such as $20, $25, and $30.

OptionsMastery: MARA Inverse H&S!🔉Sound on!🔉
📣Make sure to watch fullscreen!📣
Thank you as always for watching my videos. I hope that you learned something very educational! Please feel free to like, share, and comment on this post. Remember only risk what you are willing to lose. Trading is very risky but it can change your life!

Trend Line Test: $MARA’s Next Move?If NASDAQ:MARA has formed a bottom, a breakout above the established downward trend line may signal a potential trend reversal. This could be a bullish indication, especially if accompanied by increased trading volume or confirmation from other technical indicators such as RSI crossing above 50. In such a scenario, it might be considered a favorable entry point for traders anticipating upward momentum.

MARA Holdings Options Ahead of EarningsIf you haven`t bought MARA before the recent rally:
Now analyzing the options chain and the chart patterns of MARA Holdings prior to the earnings report this week,
I would consider purchasing the 13usd strike price Calls with
an expiration date of 2025-5-30,
for a premium of approximately $1.38.
If these options prove to be profitable prior to the earnings release, I would sell at least half of them.

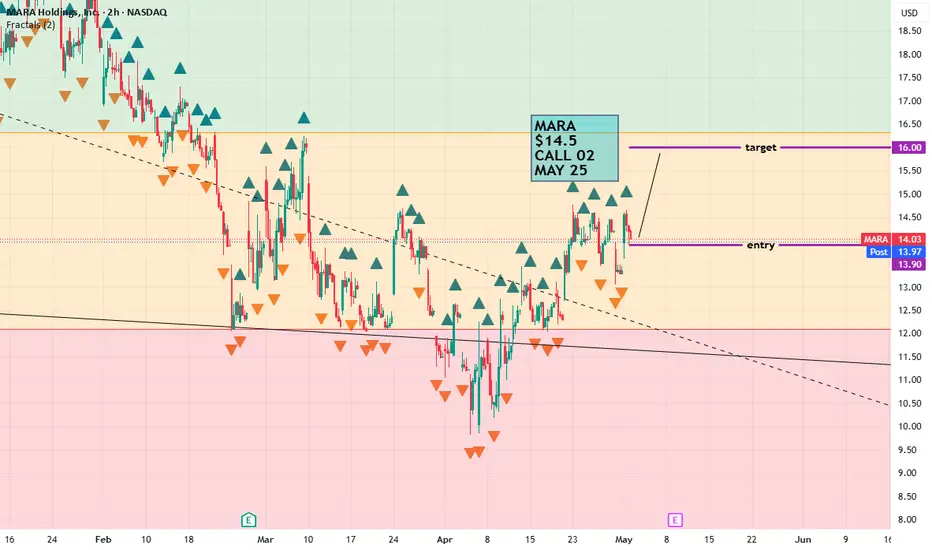
$MARA $14.5 call *This is not financial advice, so trade at your own risks*
*My team digs deep and finds stocks that are expected to perform well based off multiple confluences*
*Experienced traders understand the uphill battle in timing the market, so instead my team focuses mainly on risk management
!! This chart analysis is for reference purposes only !!
If you want to see more, please like and follow us SimplyShowMeTheMoney
20 inboundbeen watching awhile 4hr looks great to run there are daily averages overhead around 17 but i think we break above to 20 then confirm support at those averages.

$MARA still going to go under $10Even though NASDAQ:MARA has bounced, we're still not completed with the correction.
So far, we've only completed 4/5 waves down and the last leg should take us to the supports below.
I think the most likely target is at $7.64, but other two support levels possible as well.
Let's see where we end up.
Those levels will mark a great buying opportunity for the future.

MARA...Poised to turn ??MARA Holdings, Inc. is a digital asset technology company, which engages in mining cryptocurrencies with a focus on the Bitcoin ecosystem.
They have a current P/E of 8.18 and a slightly positive seasonal rating.
Generally there is a fairly good correlation with BTC.
Technically I see several patterns at present:
1. A Bullish Wolfe Wave
2. A Complete ABCD pattern
3. A Longer term Harmonic Bullish Crab pattern.
4. Positive RSI divergence appears to be present,
I point this out being fully aware of the present chaos the market is in.
Specifically :
1. With a Tariff Policy probably formulated from a CHATGPT search by a DOGE junior staffer.
2. Where s 401(K)s risks becoming a 201(K)s.
3. Where the Waffle House appears not to care and but can shift and change policy at any point.
4. Analysts estimated are positive (insert)
That said and with a stronger BTC and a generally positive market shift, I believe MARA will participate.
Note: There is a longer term crab pattern in play which suggests we may bottom out around the $7 area.
We need clarification and a reversal of currently ill advised and destructive tariff policy.
I will entertain a long position if we close above the $11.60 area with volume, a stronger BTC a positive market outlook and tariff nullification.
My Targets are marked. Analysts targets ate an insert.
Q4 and Full year earnings are set for early May. Q3 exceeded expectations
This is not Investment advice. Do your own due diligence.
S.
