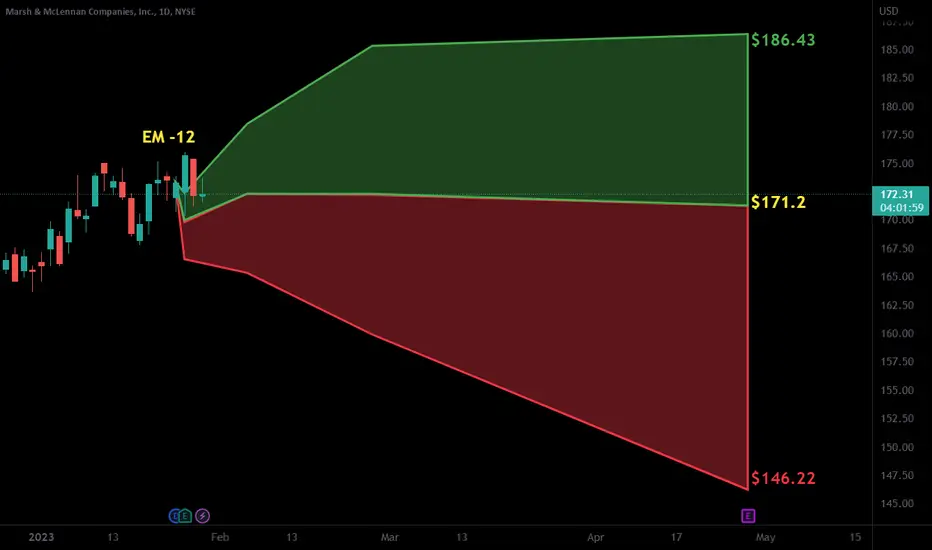
MMC Too late for now?This is my view how this may play out the next weeks.
no good entry idea coming to my head now. let's see. let's discuss, i d be happy to chat with you guys or read your comments.
cheers!
MMCO trade ideas

$MMC with a bullish outlook following its earnings #StocksThe PEAD projected a bullish outlook for NYSE:MMC after a positive over reaction following its earnings release placing the stock in drift B with an expected accuracy of 60%.

Watching the support to the channel for continuation sidewayMoving back up after consolidation is possible as the framework, pivot point, and oversold levels are ready to regain momentum. Very conservative as it is still high and still inside the channel.

UpdatE: MMC, bought, Take Profit +8.12%, STOP Loss -1.59% NYSE:MMC
UpdatE: MMC, bought, Take Profit +8.12%, STOP Loss -1.59%


$MMC with a bullish outlook following its earnings #StocksThe PEAD projected a bullish outlook for NYSE:MMC after a negative over reaction following its earnings release placing the stock in drift C with an expected accuracy of 60%.

Marsh & McLennan Companies (MMC) Weekly Chart AnalysisCompany: Marsh & McLennan Companies
Ticker: MMC
Exchange: NYSE
Sector: Financial Services
Introduction:
Hello and thank you for taking the time to read my post. Today, we analyze the Marsh & McLennan Companies (MMC) chart on the weekly scale, focusing on a classic price pattern called the "Rectangle Pattern." Marsh & McLennan Companies is a global professional services firm operating in the financial services sector, traded on the NYSE under the ticker MMC.
Classic Rectangle Pattern:
The classic rectangle pattern is a chart pattern formed when the price of an asset moves between two parallel horizontal lines, representing support and resistance levels, over a period of time. In essence, it reflects a consolidation phase where the market is undecided about the direction of the trend.
Analysis:
In the case of MMC, we find a textbook example of a rectangular formation, with several points of contact to the upper and lower boundary. The resistance was at 177.32 and the support at 146.73. The price pattern has formed for 497 days, and now, for the first time, a weekly candle has closed above the resistance level of 177.32. The price is currently retesting the resistance as support, which provides an ideal entry opportunity. The price is clearly above the 200 EMA, implying a bullish environment.
Additional Analysis:
With the breakout above the resistance level, we should closely monitor MMC's price action for confirmation that the breakout is genuine and not a false breakout. A successful retest of the 177.32 level as support could signify that the breakout is valid, and we may expect the price to move towards the target at 203.53, which represents a ~15% price increase.
Conclusion:
The Marsh & McLennan Companies (MMC) weekly chart showcases a classic Rectangle Pattern, reflecting a consolidation phase in the market. A breakout above the resistance level and a successful retest as support indicate a bullish scenario. By closely monitoring the price action and support and resistance levels, traders can be better prepared for any potential price action in the future. As always, it's essential to consider risk management and proper position sizing when trading based on chart patterns.
Please note that this analysis is not financial advice. Always do your own due diligence when investing or trading.
If you found this analysis helpful, please like, share, and follow for more updates. Happy trading!
Best regards,
Karim Subhieh

$MMC with a bullish outlook following its earnings #StocksThe PEAD projected a bullish outlook for NYSE:MMC after a positive under reaction following its earnings release placing the stock in drift A with an expected accuracy of 63.64%.

Bouncing up on Marsh&McLennan. MMCWithin a channel, looking like ABCDE according to Elliot. Volume flow toward longs, and I bet P/C Ratio is bullish also.
I never shared an idea on this one for a while, but you can see a Gartley painted in there and the result.
We are not in the business of getting every prediction right, no one ever does and that is not the aim of the game. The Fibonacci targets are highlighted in green with invalidation in red. Confirmation level, where relevant, is a pink dotted, finite line. Fibonacci goals, it is prudent to suggest, are nothing more than mere fractally evident and therefore statistically likely levels that the market will go to. Having said that, the market will always do what it wants and always has a mind of its own. Therefore, none of this is financial advice, so do your own research and rely only on your own analysis. Trading is a true one man sport. Good luck out there and stay safe.

$MMC with a Bearish outlook following its earnings #Stocks The PEAD projected a Bearish outlook for $MMC after a Negative under reaction following its earnings release placing the stock in drift D with an expected accuracy of 66.67%.
$MMC with a Bullish outlook following its earnings #Stocks The PEAD projected a Bullish outlook for $MMC after a Positive over reaction following its earnings release placing the stock in drift B with an expected accuracy of 50%.

MMC PRICE FORECASTLately ive been picking from Warren Buffets Portfolio and finding stocks in
the same industry to outperform
I will re invest when im Guaranteed the markets recovered
Sector: Financial
Industry: insurance brokers
RECOVERY YIELDS FROM JUNE
MMC 20.02%
AJG 27.62%
BRO 26.15%
BRP 41.74%
CRVL 26.10%
ERIE 37.73%
In Conclusion
BRP for the win in a recovery DO YOUR OWN DUE DILIGENCE
SENNA SEASON

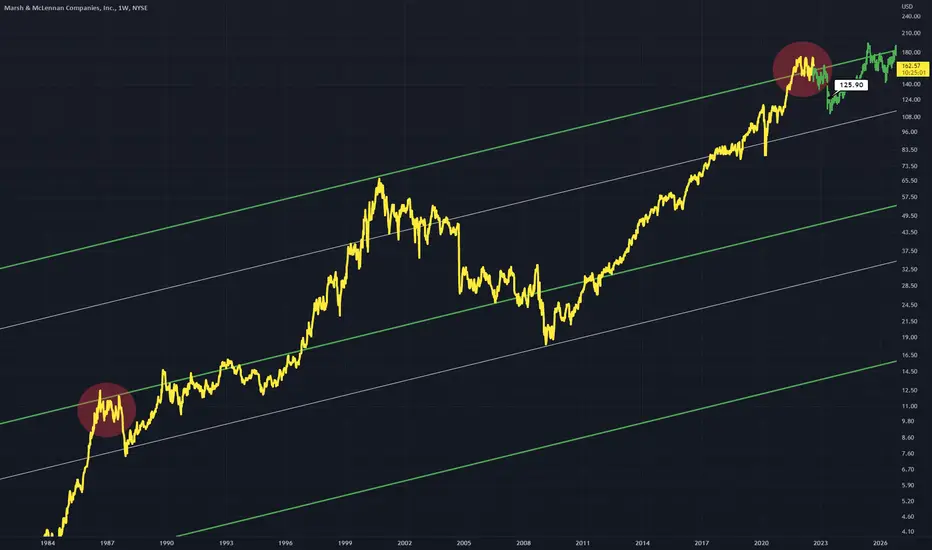
MMC - Similar Trend Line Test InstancesMMC Is testing a parallel resistance zone This can be compared to a previous point in price evolution history where this occurred also Both situations will result in a short rejection
$MMC with a Bullish outlook following its earnings #Stocks The PEAD projected a Bullish outlook for $MMC after a Positive Under reaction following its earnings release placing the stock in drift A with an expected accuracy of 60%.

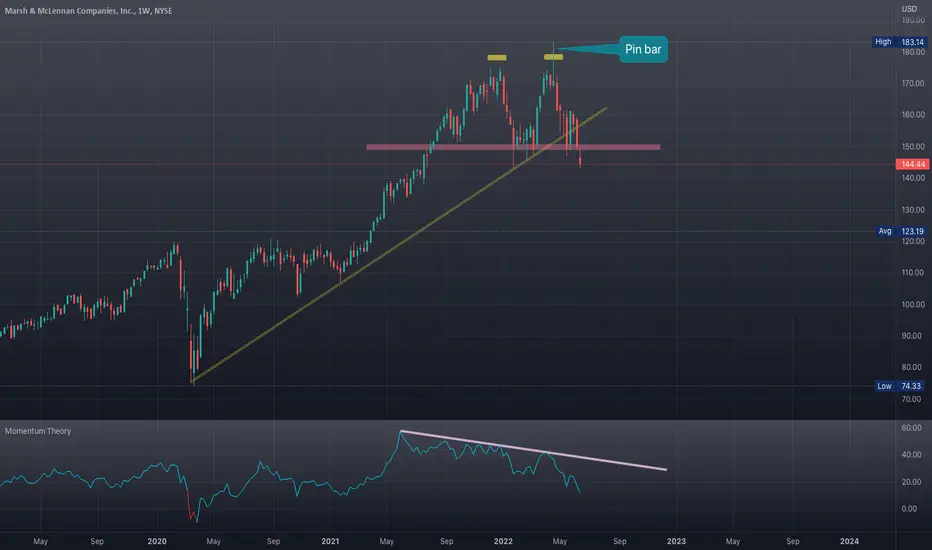
WATCH $MMCBearish
Fundamental
- Funds are distributing
- Top industry group
- Top position in sector
- Positive returns
- Negative PEG
TA
- Bearish divergence on the momentum theory indicator
- Momentum is diving
- Long pin bar rejection
- Price broke 2 years upward trend line
- Double tops
- Price below neckline major S/R
MMC - Last Ticket for Bulls?One of the global professional services firms that is still enjoying the bull run but is it for long and can retail investors join it?
Fundamental indicators:
Revenue and Profits - consistent long term growth for the past 10 years
Profit margin - effective company with circa 16%
P/E - overpriced at 25
Liabilities - no problems
Technically:
Following the correction in March 2020 which has completed an Extended Flat wave, there was an explosive growth in the final 5th wave
It looks like the lower degree waves have also progressed to the extended 5th where the final impulse is about to start once the current Running Flat correction is finished
The target for the final wave can be identified by Fibonacci levels and in the range from $187 to $209, which are 0.618 and 1x of wave 3 respectively
Given the next earnings report is in the end of July, this bull trend may last until then
Looking at both fundamental and technical indicators there might be a possibility for short term trade with a circa 20% upside, however risks are growing and it might be better idea to wait for the report and act accordingly.
What do you think about this idea?
Please share your thoughts in the comments and like this idea if you would like to see more stocks analysed using Elliott Waves.
Thanks

$MMC with a Bullish outlook following its earnings #Stocks The PEAD projected a Bullish outlook for $MMC after a Positive over reaction following its earnings release placing the stock in drift B with an expected accuracy of 100%.

Breakout on the MMC chart?NYSE:MMC
Yesterday the price closed above resistance, making a new ATH.
What are your expectations for MMC? Please leave a comment.
This is what I see on the chart, please correct me if I am wrong.
- We have a purple square as support, because MMC opened higher there is a small gap.
- I see a Cup and Handle pattern that started on 30-12-21.
Cup (30-12-21/7-4-22) Handle (8-4-22/19-4-22)
- There is a big volume shelf around $171, this could also indicate possible support.
- Price closed above the highs of 8-12-21 & 28-12-21 & 8-4-22. This means a new ATH,
What I expect: Maybe a small rally from here, or anyway a pullback to the old resistance level ($170.00). I hope that the former resistance level becomes a new support level (Principle of Polarity), and then the price soars to new highs.
This is no financial advise.

Marsh & McClennan Companies MMC - Short Setup on WeeklyJust another in a series of similar charts where a textbook short is setting up on the weekly. Risk/reward to first PT/Stop loss is excellent in the zone indicated.

$MMC with a Bullish outlook following its earnings #Stocks The PEAD projected a Bullish outlook for $MMC after a Negative over reaction following its earnings release placing the stock in drift C with an expected accuracy of 50%

MMC looking to make new highs!Note: I last spoke about MMC around mid October and since then it has consolidated and now it's showing signs of going higher.
* Excellent earnings
* Very strong up trend
* Very high 3-mont relative strength of 6.87 in the Financial sector
* Breaking out of a ~2 month base with higher than average volume
* We can see that it tried to break above earlier but came back down due to the market volatility
* It's also showing healthy signs for a continuation on the weekly chart
Trade Idea:
* If a little volatility doesn't bother you, now's a great time to enter as the price is still close to the broken level.
* Moving forward, $171.13 should serve as support so if you're looking for a slight discount you can look for an entry around that area.

MMC breaking out of consolidation!* Great earnings
* Strong up trend
* High relative strength in the Financial sector
* Breaking out of a month long consolidation with higher than average volume
* Pays dividends
Note:
* Earnings are coming up this week. Given it's past performance we can expect it'll have a good report and the price to go higher.
Trade Idea:
* You can enter now as indicated since it's still very close to the broken resistance
* If you're looking for a discount you might find an entry near the 159.40 area

