MMCO trade ideas

Breakout pattern hereIgnore tech, buy this sector and this name in particular is showing up. Strong on bad macro days, strong breakout. Get in!


MARSH & MCLENNAN COMPANIES PerformanceHey guys, MARSH & MCLENNAN COMPANIES is on a bullish oblique it is a full bullish acceleration, we can pass the 4 higher with the candle cross.
Please LIKE & FOLLOW, thank you


Lightning cloud just crossed above Thunder cloudThe prices formed a double-bottoms reversal pattern in April, 2020 and has just broken above the 250-day (red line) moving average and the upper boundary of a rising wedge pattern. The lightning cloud has just broken above the thunder cloud with a narrow shape and is heading upwards. The future thunder cloud has twisted to bullish, while Span A is heading upwards. The daily RSI stands firmly above its neutrality level at 50% and is heading upwards. The MACD is above its signal line and 0-level, while the MACD histogram is broadening.
In these perspectives, the outlook is positive. With the cloud support, prices are likely to further advance and challenge the next resistance at $110.67 (Mar 2020 top + near 78.6% fib. retracement between Feb 2020 high (point A) and Mar 2020 low (point B).

MMC (MMC - US) WXY wave pattern MMC (MMC - US) is within WXY pattern. Y down wave already started. Sell with stops above 96.44 for c wave down of Y. It is also under-performer stock to market.


going down high probability Hello and welcome to my analyze traders
As you can see first we have a divergence signal witch is strong enough also uptrend has been broken and you can see clearly the support and resistance levels go with the first arrow could be more to the second arrow
GOOD LUCK


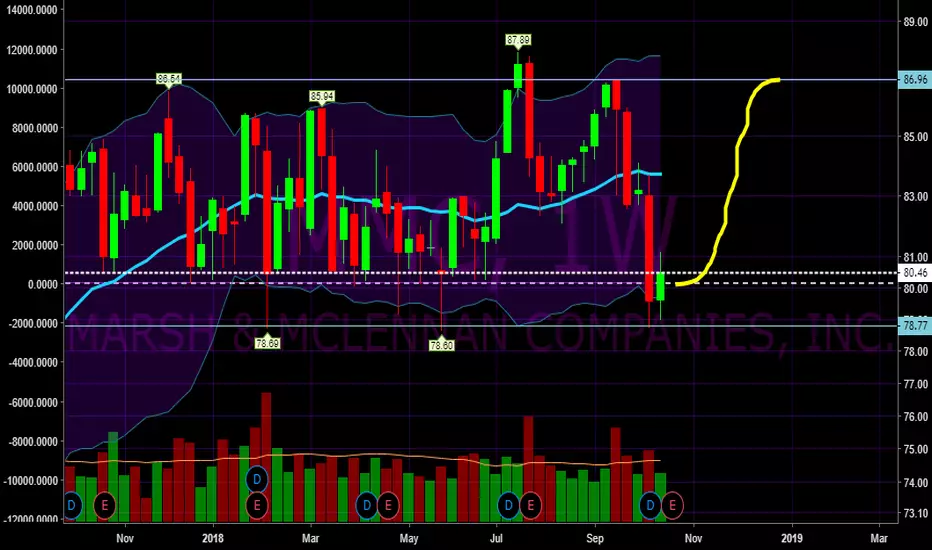
$MMC - Peep the breakout bruh 0% DD on this company at all - no idea what sector it even belongs to. Either this chart is sexy as fuck or I'm boutta be A-ok losing alotta $. Yellow line marks a big move, (I'd say up but, could go either way) - $92 PT

Marsh & McClennan price to rally until end of year? MMCLooks like we could see a bounce off resistance and a return to the top of the price channel that this stock has been in for some time.
Like the idea if you agree.
Follow me for more like this.
Bull Flag/Rectangle, Look for Entry Point at $79.50MMC is trading in a nice channel atop of a upward trend. Looking for $79.50 for a good entry point.
Target price is $83.75, pattern break out is $86.50. Bull flag/rectangle patterns are around 70% reliable.

MMC moving upHow I saw a buy opportunity:
Stock price jumped off the support line I drew from 30OCT17 close price of $80.62.
Stochastic Oscillator (14,3,1) 3JAN18 had a crossover and moved above 20.
My 5SMA - 10SMA had a crossover on 3JAN18.
My play in the trading simulator game:
I was full of anticipation and bought too early.
On 2JAN18, I bought 700 shares at $81.65, one May option with a $80 strike for $3.50, and one May option with a $85 strike for $1.20.
On 3JAN18, I got worried because the stock was dropping and decided to buy more in order to dilute my overall buy price. I bought 700 shares at $81.44
So far so good. Will it climb above my lower trend line? Simon says yes...momentum is good.

MMC Ichimoku CloudPlaying Trading Simulator Game:
Price crossed green cloud in DEC/JAN.
Cloud changes from green to red in about 3 weeks followed by an earnings report.
The price has dropped drastically after each report the last two times.
Watch for now.


Marsh & McLennan (MMC) To Drop On Next Two Day PullbackMarsh & McLennan Companies has been in a bullish trend since 2009. It has been on a quicker and narrower bull trend since the beginning of 2016. On multiple occasions through this trend, three of the technical indicators discussed below are at similar or higher levels, than they are now. These instances have resulted in short-term losses for the stock. I have laid out the reasons and levels to which the stock may drop while it most likely continues its long-term trend.
When we look at technical indicators, the relative strength index (RSI) is at 81.3492. RSI tends to determine trends, momentum, overbought and oversold levels as well as likelihood of price swings. I personally use anything above 75 as overbought and anything under 25 as oversold. Currently the RSI well overbought.
The positive vortex indicator (VI) is at 1.4006 and the negative is at 0.6499. When the positive level is higher than 1 and higher than the negative indicator, the overall price action is moving upward. When the negative level is higher than 1 and higher than the positive indicator, the overall price action is moving downward. The positive value is at one of its highest levels ever. This always results in a pullback for the stock which should begin within days.
The stochastic oscillator K value is 92.5655 and D value is 89.1630. This is a cyclical oscillator that is highly accurate and can be used to identify overbought/oversold levels as well as pending reversals and short-term activity. I personally use anything above 80 as overbought and below 20 as oversold. When the K value is higher than the D value, the stock is trending up. When the D value is higher that the K value the stock is trending down. The stochastic is very overbought. It cannot sit at this level much longer. Once the K value crosses below the D, the stock should begin to drop.
SPECIFIC ANALYSIS
I have created an algorithm (called SAG gauge) which signals when stocks are truly overbought and oversold. The algorithm indicates when a particular stock meets multiple criteria which culminates in an oversold or overbought alert. That signal will occur within the next few days once the stock sees two days of consecutive drops. Because this signal will go off after continued drops, now is the best time to enter a position and take greater advantage of the pending downward movement.
Upon back-testing this indicator, it has signaled overbought status 82 times dating back to 1987. Eighty percent of the time the stock drops at least 0.75% over the following 30 trading days after the indicator date. Seventy percent of the time, the stock drops 2% and fifty percent of the time drops 4%.
In the history of this stock, it always drops a minimum of 2.55% when the positive VI is at or above its current level at the same time the RSI is at or above its current level. This additional study requires the stochastic to be overbought as it is today too. Eleven occurrences met this criteria and were studied. The median loss for the stock is 5.13% and the loss takes a median of 21 trading days to occur. The standard deviation for this first study is 2.42%. Five of these instances occurred at the same time the SAG gauge determined the stock to be overbought. The minimum loss for these instances is 3.12% and the median drop is 3.80%. The standard deviation for this second study is 1.48% The maximum movement for this stock could occur within the next 17-30 days.
Considering the RSI, VI and stochastic levels, the overall direction favors a move to the downside. Based on historical movement compared to current levels and the SAG gauge, the stock could drop at least 3% over the next 37 trading days if not sooner.


