MORGAN STANLEY going to file BANKRUPTCY by 2021In 200 it peaked then in 2007 it peaked again and now in 2015 it peaked. But all the time it went high it made lower lows in historical prices trend. The support is near $10-$10 but when it penetrates guess what? -all the hell will break loose. There are couple of ways to stop it. Stock reverse split, bail out or short ban or buy out. But the problem is when other financial institutions are struggling their own who want to buy MS ? Due to their corrupt accounting system we can't even get the real values of the junk assets they are holding. may be only few pennies on the dollar. The other options also will not work out in long term. Think by 2012 it will be vanish their foot print from earth.
MWD trade ideas


200 MA breakoutLooking for a long entry here on $MS as it breaks above it's 200 day moving average on the 5 year chart. The 40 and 50 day moving averages are beginning to curve for a possible upward movement reflected. Current Trend is up for the year. I am looking for an entry today above yesterday's high with a stop loss around previous highs in the $27 range. $3 downside for possible $6+ upside leaving a 2:1 ratio or better.


MS-Solid uptrend channelThis stock is trending in an uptrend channel and looks to fill the pink gap and burst higher.
Buy the July 01, 2016 calls at the market. Look for 30% profit


Morgan Stanley $MS earnings before the bell on Monday There are no actionable signal, this company seems cheap to me. I don’t think this is a buy but, had a good month opening. This Financial company is under priced if you look at the weekly chart. This Monday morning we are going to get Morgan Stanley $MS earnings before the bell. I don’t think this financial stock is a buy or a hold

Perfect Symmetry Bearish Cypher PatternNIce retracements on nice levels,the rsi divergence and the candle it is the kind of confirmations is needed for any entry into these mercados.Thanks and have good weekend,If you like please hit the button ,feel free to leave your comments

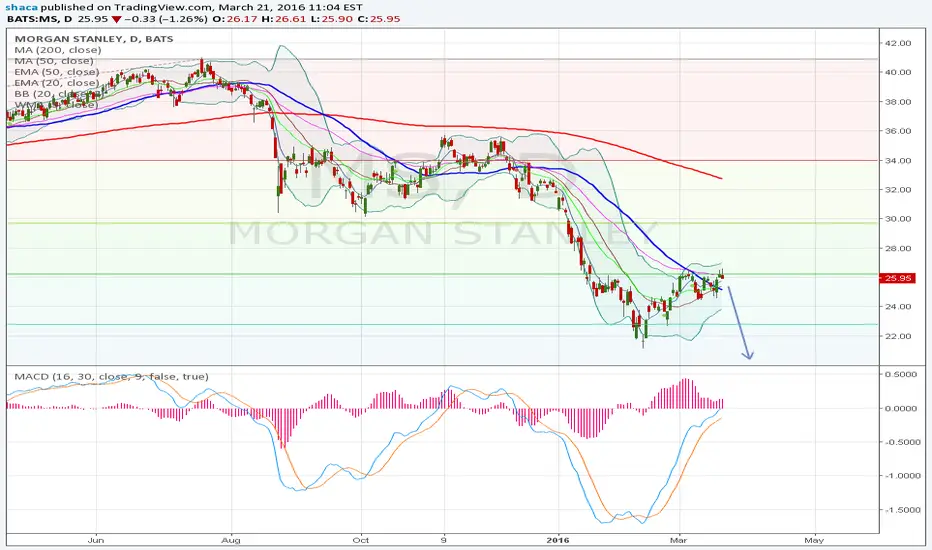
MS set to test year to date highsBank stocks have paused over the last 3 trading sessions but still look poised for further significant upside should there be further buying. MS has held $26 over this pause but we would be interested in a move over $26.30 in entering a long call position.

Short MS entry 25,19 in the down-trend directionWith the base rate reduction and for the fiscal year ended December 2015, MS revenues decreased less than 1% to $37.9B. Net income applicable to common stockholders excluding extraordinary items increased 80% to $5.69B.

MS cooking for complete technical reversalTechnical reversal will be confirmed on a break of $25, which should also coincide with confirmation of a reversal on the S&P500 as a whole. This price level will also mean a cross of the 5/15 EMAs and a potential test of $26 as a scalping target.


MS - ShortWorld equity market slumps, IPO, trading volume will shrink. Cutting jobs definitely helps - help us to have a better short position. New to trading, please comment.


MS heading towards key levelA move above 437.50 would appear to be an interesting level which we would look to a bought call to take advantage of any further move higher.
the price site above all key moving averages and Fridays pull back on low volume medoks like pre-earnings nerves which now should be caled

MS to ride on Yellens dovishnessMS are approaching previously important $37 and a break could at lest see the underlying test $38 and perhaps even $39 highs. Looks like a favorable scalping bought call trade potentially

Bankers ready to share profitMorgan Stanley stocks look set to take off. Breaking out of the flag pattern above USD 35.70 will also mark the breach of a strong historical level. In this case, the stock could move towards the triangle’s highs of USD 36.30, which, if crossed, would pave the way for 50% upside over the next couple of months. The price band of USD 52-54 will also be attractive for speculative traders, so the stock will most likely reach that range. A new bout of consolidation can be expected at this level, the exit from which, in terms of the direction and time, is still hard to predict for the time being. So far, buy what bankers have to offer, with a target price of USD 52-54.
My forecast participates in the Market Forecaster contest. Follow the link s30061920484.whotrades.com
to vote for it and help me win the top prize. Thank you.


MSH&S or AB=CD. Since the M&A and IPO cycle may be winding down, I think further weakness seems likely. But I'm not FA. I'm TA.
