A bull case Wyckoff accumulation NVAXA bull case Wyckoff accumulation. If the test is successful it will be marked up
NVAX trade ideas

NVAX and DOT Indicator Bounce TradeTook small trade on bounce off of 21 DAY MA and again on recovery. Note how dot indicators show levels of support - this is a historic trade if you look back this happens at intervals. See June 3.

NVAX again - it's party time with GANNAfter 6 months of suffering, next 2 weeks will be pay-week for NVAX investors. My chart should be self-explanatory, of course there are pullback along the way, I'll let you figure this out on your own. It took me sometime to put this together. So enjoy. Hopefully some of these come out correctly :)
(This is a near term chart - the white line is the trend line)

NOVAVAX Long term countWeekly update with my long-term scenario... It looks short-term bearish, but it is the best scenario for long-term bulls according to Elliott waves! It has a gap fill in the low 20s, and then a wave (c) super cycle will start. As you see on the side there is a gap of volume below 35 and then a huge amount of volume from 10s-20s, I am not saying we will go there, but needs to be served somehow, maybe 20-25... The catalyst from the revisit of the lows maybe will be a market crash or lower covid cases and no new orders, maybe a new pill, I don't know... But I think we are not out of the woods just yet, not so easy!

Novavax - Wassup?Novavax NVAX is actually lining up pretty well... from about 240, it tanked to 40, and on Friday, it gained 11% to close the week at 57.15.
This caught my attention as it cleanly broke out of trendlines, breaking out also from a bearish divergence, on BOTH the weekly and daily chart.
IMHO, it appears to be in technical and fractal alignment.
Weekly chart bounced off a major support two weeks ago, and the last week continued the previous week's bullish end. On the daily chart, Friday's close was the highest daily close in about 5 weeks. with a strong candle closing draws obvious bullish attention.
Target 80, then 125.
Support at 53 and 50.

New update for NovavaxI think NVAX is doing an irrelevant ABC correction and wave 5 will follow... If wave 2 fibs will be broken I will be more confident to short it more. Bearish divergences on rsi and stochastic and MACD.

Don't sleep on NVAXWhat I am seeing here is the most sophisticated accumulation setup I have come across in the market - and CO has been doing this for NVAX cyclically every pandemic in the past. The company focuses on stopping the propagation of viruses, however, CO spins it by propagating demand (like a virus) and absorbing supply which they injected intentionally at strategic stages downstream! This is nice, nested markup activation.
Sorry if its difficult to see clearly, that is for me. I will post a followup idea where I zoom in and discuss the projected most likely scenarios. But here is the bigger picture that I wanted to present as surprisingly high probability targets/critical levels to watch in the coming weeks. I used MRNA epic run in summer 2021as a proxy, as well as a general method that I developed to make such predictions on Markup phases.
- Minimum Target by August is 119 (given that 79 can be breached in time - will discuss the time component in followup post).
- Sweet spot/target spot I'm expecting by mid September is 217-229
- If they invoke chaos w.r.t. demand and break above 171 by Jul 25th, then max target by mid-Septemer is ~350 (when such a squeeze occurs as it did last Jan, and it is highly likely is what we are about to see, establishing a point target is nearly impossible so the max target range 300-400).
*** NVAX activated markup on Friday July 1st. There is a nested activation that will trigger if it gets above 63-65 by July 11th-18th, and there is an carryover activation level at 171 which regained the capacity for activation on 3/21/2022 - for it to be reactivated, the price must break above it by 7/25/2022.
Smuggled between these activation levels, there are price (%) doubling and period halving bifurcation levels where the price will gap if hit. These require a massive squeeze, which NVAX is more than capable of currently - these levels are at 65, 83, and 217.
The next supply/demand equilibrium point is July 5th, so good chance they will announce approval before the bell tomorrow. Once time crosses the equilibrium point there are windows where the activation and bifurcation levels remain in effect. So if price keeps up with time or exceeds it, here is what I expect:
- Gap up Tuesday to trigger 63-65 and then continue to resistance at 79 by July 7th-8th
- After rejection from 79, it will pullback and test 65 for support, if that holds and it bounces I'd expect the 2nd wave of the squeeze to kick in and drive it above 79. They have the bifurcation set in place at 83 to gap it toward 100 once it hits 83.
- From there it gets tricky, because there is another nested markup activator that I haven't even discussed because its beyond the scope of this post, it was a distribution phase beginning in Jan 2022.. my theory is that it serves the purpose of kicking in the 3rd and final phase of the squeeze once 83 is breached. It is the only way I see this getting over 119. There is an attractor at 106 that could allow them to re-accumulate there in order to breach 119. If they make it to 131 it will begin a rally similar to what MRNA saw in 2021. For NVAX, it looks like above 131 will open the door for 171, then gap to 217-229, and finally run to 300-400 where they will begin the final distribution pertaining to Covid-19.
When its all said and done this will make its way back down to ~20 in 2023, likely even lower by 2024.

Nested Markup (supplement idea)I was going to type up some additional notes pertaining to my other post, but actually its time for some fireworks soon so I'll just leave this here - knock yourselves out. Will probably send update in the morning touching on the projected paths shown.
Reference this post for general expectations on levels. If you leave with any message its that things might get violent with NVAX price action these next few weeks.

NVAX - the FDA waiting game (updated)Staying strong in the red market while QQQ went back to fill some gaps. But shorts interest remain 20%. Hopefully we get a nice squeeze into FDA approval
My fib based time is pointing to $73 target on July 5th for now - fingers crossed. - Regular fibs at 61.8 and my trend lines are matching.

NVAX Target 72$ on June 28thSee my TA below. Comment for questions :). Using My Fibs lines based on major pivot dates and Gann Square

NVAX headed downLooks like novavax NVAX has confirmed its intention to head down. around 4 to 1 rr possible.

$NVAX starting its run?With main confluence from MACD , Stochastics, RSI and MTF EMA's, I am expecting a run to 69.28. Momentum looks to be rising on the Daily, but if you look closer on January 26th we see divergence on the MACD indicator (Orange). While price reached a low at that time, MACD has been steadily rising. Price has been driven lower through this time but MACD has been rising. This in connection with the RSI's and Stochastic's tell's me we are starting to see the run up. I committed to this trade on the 6th of June and don't plan on selling until profit target of 69.28.
Depending on momentum once we've reached there, I will close part of my position to allow a possible ride to the golden pocket of the Fibonnaci indicator of .618
Ideally, this is a very technical play, I think with momentum showing to be on the higher side we should see a nice steady run up over the coming next week.
Stay tuned
Im working on an indicator that will help visualize market volatility and momentum. The goal of the indicator is to help you understand current market strength which direction it's favoring.
Before releasing, I am going to fine tune the indicator further to make it more profitable per back testing with python.
I'll release this indicator once it's ready at free cost for a limited time only.

New update for NovavaxWeekly Update! The best time of the week is when you have a clear mind and time to check the TA.
I have seen this movie a couple of times before. One was not so far ago... April 6th. Sharp move down after a breakdown of a bear flag. RSI in extreme levels marked the wave iii of wave 3. Then bear flag again, triangulation of the rsi with inside hidden bearish divergence, and another move down to complete the wave v of wave 3.
Now, again the same... Sharp move down after a breakdown of a bear flag. RSI in extreme levels marked the wave iii of wave 5. Then bear flag again, triangulation of the rsi with inside hidden bearish divergence, and... waiting for another move down to complete the wave v of wave 5. Both bear flag projections coincide with the target of the Elliots waves, it does not leave room for questions... Also, volume is decreasing, as expected from Wyckoff's theory, one final? shake out is expected

New update for Novavax (elliot waves)Finally, the price broke down after a few attempts that failed and eventually became bull traps. It was a very complex move to navigate and many times a trader can lose patience...
Now we are on the way to completing wave 5 or C (I have labeled it with both). We may see a retest of the upper wedge line which will be wave (iv) or c. There will find the 2h supply zone. To support this action, some will notice the weak bullish divergence of rsi.
Imo we will see volume decreasing, as we already see some, and when eventually it diminishes, we will see a decisive test of the remaining supply into the end of wave 5. There we may see a bear trap as the bears will see a channel break down, latecomers will be trapped and fear will be all over retail investors allowing smart money to accumulate the remaining floating supply in ghost mode.

Novavax: IT'S TIME TO GONovavax
Short Term - We look to Sell at 48.97 (stop at 53.42)
Prices expected to stall near trend line resistance. Trading volume is increasing. The trend of lower highs is located at 55.90. Preferred trade is to sell into rallies. A break of yesterdays low would confirm bearish momentum.
Our profit targets will be 22.96 and 13.90
Resistance: 50.00 / 63.00 / 100.00
Support: 41.00 / 23.12 / 15.00
Disclaimer – Saxo Bank Group. Please be reminded – you alone are responsible for your trading – both gains and losses. There is a very high degree of risk involved in trading. The technical analysis, like any and all indicators, strategies, columns, articles and other features accessible on/though this site (including those from Signal Centre) are for informational purposes only and should not be construed as investment advice by you. Such technical analysis are believed to be obtained from sources believed to be reliable, but not warrant their respective completeness or accuracy, or warrant any results from the use of the information. Your use of the technical analysis, as would also your use of any and all mentioned indicators, strategies, columns, articles and all other features, is entirely at your own risk and it is your sole responsibility to evaluate the accuracy, completeness and usefulness (including suitability) of the information. You should assess the risk of any trade with your financial adviser and make your own independent decision(s) regarding any tradable products which may be the subject matter of the technical analysis or any of the said indicators, strategies, columns, articles and all other features.
Please also be reminded that if despite the above, any of the said technical analysis (or any of the said indicators, strategies, columns, articles and other features accessible on/through this site) is found to be advisory or a recommendation; and not merely informational in nature, the same is in any event provided with the intention of being for general circulation and availability only. As such it is not intended to and does not form part of any offer or recommendation directed at you specifically, or have any regard to the investment objectives, financial situation or needs of yourself or any other specific person. Before committing to a trade or investment therefore, please seek advice from a financial or other professional adviser regarding the suitability of the product for you and (where available) read the relevant product offer/description documents, including the risk disclosures. If you do not wish to seek such financial advice, please still exercise your mind and consider carefully whether the product is suitable for you because you alone remain responsible for your trading – both gains and losses.

Bigger Picture NVAX Projection - UpdateUpdate from post yesterday - obviously the manufacturing news killed momentum so taking this opportunity to roll to July expiration and add some lower strikes at a discount.
- Chart indicates a symmetrical triangle breakdown into support. DMI suggests accumulation, this will be the spring.
- Expecting yellow path to play out as price trajectory. Forming an impulse wave that takes it right through the equilibrium point where supply = demand at the intersection of support and resistance from the triangle.
- initial target around 70 but will need to give this some time to unfold.
- mid term I see this going to triple digits easy (by end of 2022 - that is conservative)
NVAX has done this every pandemic {pop to 300s, sell off to 40s, re-accumulate and take it back into the 100s... rinse and repeat}
Sincerely,
Covid-19

Get Some.This is about to go.
I don't have time to explain why just look at order flow. I'll send update later with details.
June 17 55 calls, not financial advice.

Covid stocks still struggling (NVAX) Novavax
Short Term - We look to Sell at 54.79 (stop at 58.88)
Prices expected to stall near trend line resistance. Trading volume is increasing. The trend of lower highs is located at 55.90. We therefore, prefer to fade into the rally with a tight stop in anticipation of a move back lower.
Our profit targets will be 41.78 and 38.59
Resistance: 55.90 / 63.00 / 100.00
Support: 42.20 / 23.12 / 15.00
Disclaimer – Saxo Bank Group. Please be reminded – you alone are responsible for your trading – both gains and losses. There is a very high degree of risk involved in trading. The technical analysis, like any and all indicators, strategies, columns, articles and other features accessible on/though this site (including those from Signal Centre) are for informational purposes only and should not be construed as investment advice by you. Such technical analysis are believed to be obtained from sources believed to be reliable, but not warrant their respective completeness or accuracy, or warrant any results from the use of the information. Your use of the technical analysis, as would also your use of any and all mentioned indicators, strategies, columns, articles and all other features, is entirely at your own risk and it is your sole responsibility to evaluate the accuracy, completeness and usefulness (including suitability) of the information. You should assess the risk of any trade with your financial adviser and make your own independent decision(s) regarding any tradable products which may be the subject matter of the technical analysis or any of the said indicators, strategies, columns, articles and all other features.
Please also be reminded that if despite the above, any of the said technical analysis (or any of the said indicators, strategies, columns, articles and other features accessible on/through this site) is found to be advisory or a recommendation; and not merely informational in nature, the same is in any event provided with the intention of being for general circulation and availability only. As such it is not intended to and does not form part of any offer or recommendation directed at you specifically, or have any regard to the investment objectives, financial situation or needs of yourself or any other specific person. Before committing to a trade or investment therefore, please seek advice from a financial or other professional adviser regarding the suitability of the product for you and (where available) read the relevant product offer/description documents, including the risk disclosures. If you do not wish to seek such financial advice, please still exercise your mind and consider carefully whether the product is suitable for you because you alone remain responsible for your trading – both gains and losses.

NVAX Ctitical levels to watchIt will be interesting to see if it holds above 44, the price has bounced off around 42, and major support around 40

NVAX Wyckoff Accumulation events + Elliott waves$NVAX My memorial day homework 😁
Wyckoff Accumulation events + Elliott waves
I have attached my two main theories that are happening together and we are approaching the end of it soon.
For wyckoff, I am expecting a big shakeout to follow. We haven't seen yet a day that has the qualities of a spring. We have only experienced some rallies that turned back quickly to the support/supply area, which imo is a test. We need to see massive selling volume and accumulation.
That is coming together with the Elliott waves count. I have an alteration of the count, but does not change anything in the final outcome. I just wanted to show the similarities with the ending diagonal. A wave C or wave 5 call it as you like, is supposed to come. Maybe this will mark the final shakeout and the end of correction.

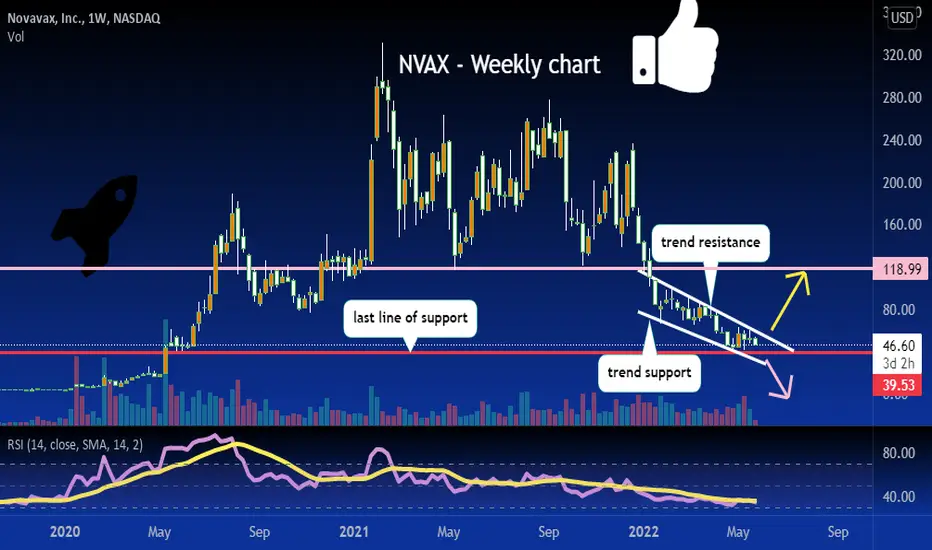
NVAX approaching its last line of support.. oof! if it cannot hold the 39-40 area a lot more downside is possible! currently approaching this level in a bearish downtrend, not a good sign for longs!
New update for Novavax (elliot waves)My weekend analysis for $NVAX
Finally, we are starting to build the long expecting and hopping final wave 5 of the primary cycle corrective wave C. It was a running flat structure, which is a rare structure, that is why it was a tricky one to understand from the beginning.
I have inserted some supply and demand areas in order to understand better where we will find supports and resistances and also where the price is "magnetizing" to go.
On the 2h chart, we see a shooting star candle, which is confirmed, and then the gap down. Now is building up a SHS pattern, in which the right shoulder will be the wave 2 of the wave 5. It is already at 50% retracement, which is inside the area of a wave 2 target and also inside the resent daily supply zone. I am expecting to be rejected from there, but it can always go further up and maybe close the gap from yesterday before going down again. The SHS pattern if it triggers, the target coincidences with the wave 3 fib.
My target area is at 38$ to 30$.

NVAX - LongNovavax, Inc. is an American biotechnology company based in Gaithersburg, Maryland, that develops vaccines to counter serious infectious diseases. Prior to 2020, company scientists developed experimental vaccines for Ebola, influenza, respiratory syncytial virus, and other emerging infectious diseases.
COVID is on the rise again. Those companies' stocks are expected to go up again.
