Nvidia long on 2 paths to 117 Great R/R on NVidia here .. that's it really easy trade, Hard part is do you sell it all at 117 or keep some
NVDA trade ideas

NVIDIA (NVDA) – Inverse Head & Shoulders Breakout in PlayNASDAQ:NVDA NVIDIA (NVDA) – Inverse Head & Shoulders Breakout in Play
NVDA has broken above a key neckline at $108, confirming a classic inverse head & shoulders pattern. With the head at $85, the breakout projects a target around $138.
Trade Plan:
Entry: $117 (current level)
Stop Loss: $107 (below neckline)
Target: $138
Risk–Reward: ~1:2.1
Strong volume on the breakout adds conviction. Watching for continuation toward the projected target in the coming weeks.
#NVDA #Breakout #InverseHeadAndShoulders #SwingTrade #TechnicalAnalysis

NVDA Weekly Options Trade Plan 2025-05-07NVDA Weekly Analysis Summary (2025-05-07)
Model Summaries
Grok/xAI Report
Technicals: Price $117.06 above all key EMAs; bullish MACD on 5-min and daily; RSI overbought short-term (75) but neutral daily (59); trading near upper Bollinger Bands. Sentiment: VIX elevated at 24.76; mixed news (AI rally vs. supply delays); max pain at $111 suggests some bearish undertone. Direction: Moderately bullish with caution for pullback. Trade: Buy naked $113 put (premium $0.59) anticipating pullback, stop if $119 breach, target 25–50% gain, 65% confidence.
Claude/Anthropic Report
Technicals: Strong intraday uptrend; bullish MACD and RSI neutral daily; immediate resistance at $117.68. Sentiment: Sector tailwinds, positive news, but VIX elevated and max pain at $111. Direction: Moderately bullish. Trade: Buy $121 call at $0.75, profit target 100% ($1.50), stop-loss 40% ($0.45), 65% confidence.
Llama/Meta Report
Technicals: Bullish MACD, overbought short-term RSI, mixed reversal risk. Sentiment: Mixed news; VIX rising; max pain theory. Direction: Moderately bullish but immediate entry risky—overbought, mixed signals. Trade: No trade recommended at open (confidence <60%).
DeepSeek Report
Technicals: Bullish breakout, expanding bands, RSI overbought M5 but room on daily. Sentiment: Positive AI policy news; VIX manageable; max pain unlikely to derail strong technicals. Direction: Strongly bullish (70% confidence). Trade: Buy $122 call at $0.56, target $1.12, stop if $115.86 break, size 3–5% of capital.
Gemini/Google Report
Technicals: Strong uptrend but very overbought short-term. Sentiment: Mixed news with supply concerns; VIX rising; max pain $111 adds caution. Direction: Neutral/unclear for immediate trade (confidence <60%). Trade: No trade recommended at market open. Areas of Agreement and Disagreement
Agreements
All models see a strong intraday and daily uptrend with price above key EMAs and bullish MACD. Short-term RSI is overbought, suggesting potential for pullback or consolidation. VIX is elevated (~24.8), signaling caution. Max pain at $111 introduces a bearish tether toward expiration.
Disagreements
Trade selection: Grok favors a bearish put; Claude, DeepSeek favor bullish calls; Llama and Gemini hold off. Confidence: DeepSeek is most bullish (70%), Grok and Claude are moderately bullish (65%), Llama and Gemini see too many conflicting signals for immediate action. Strike selection varies widely: $113 put, $121 call, $122 call, or no trade. Conclusion
Overall Market Direction Consensus: Moderately bullish for the week, with elevated short-term risk of pullback.
Recommended Trade
Strategy: Single-leg naked call Instrument: NVDA weekly options (expiry 2025-05-09) Strike: $122.00 Call Premium: ~ $0.56 Entry Timing: At market open Profit Target: $1.12 (100% gain) Stop-Loss: $0.34 (40% loss) Confidence: 70%
Key Risks and Considerations
M5 RSI overbought (75) risks a short-term pullback. Elevated/rising VIX may induce whipsaws. Max pain suggests potential downward drift into expiration. Monitor any fresh supply-chain or sector news at open.
TRADE_DETAILS (JSON Format)
{ "instrument": "NVDA", "direction": "call", "strike": 122.0, "expiry": "2025-05-09", "confidence": 0.70, "profit_target": 1.12, "stop_loss": 0.34, "size": 1, "entry_price": 0.56, "entry_timing": "open", "signal_publish_time": "2025-05-07 20:16:47 UTC-04:00" }
Disclaimer: This newsletter is not trading or investment advice but for general informational purposes only. This newsletter represents my personal opinions based on proprietary research which I am sharing publicly as my personal blog. Futures, stocks, and options trading of any kind involves a lot of risk. No guarantee of any profit whatsoever is made. In fact, you may lose everything you have. So be very careful. I guarantee no profit whatsoever, You assume the entire cost and risk of any trading or investing activities you choose to undertake. You are solely responsible for making your own investment decisions. Owners/authors of this newsletter, its representatives, its principals, its moderators, and its members, are NOT registered as securities broker-dealers or investment advisors either with the U.S. Securities and Exchange Commission, CFTC, or with any other securities/regulatory authority. Consult with a registered investment advisor, broker-dealer, and/or financial advisor. By reading and using this newsletter or any of my publications, you are agreeing to these terms. Any screenshots used here are courtesy of TradingView. I am just an end user with no affiliations with them. Information and quotes shared in this blog can be 100% wrong. Markets are risky and can go to 0 at any time. Furthermore, you will not share or copy any content in this blog as it is the authors' IP. By reading this blog, you accept these terms of conditions and acknowledge I am sharing this blog as my personal trading journal, nothing more.

NVDA, CONFIRMED BAT, SWING TRADEWait for PA to pullback to VWAP after recent advance (100). VWAP may provide a good entry for a swing to TP2. Good risk to reward, stop just below lower band (light blue) loss = 1% of acct. 30% profit taking at TP1, exit at TP2 or if PA closes under TP1 after hitting TP1.

NVIDIA Corporation: Bullish ConsolidationThe NVDA stock is facing resistance at the 0.5 Fib. extension level. This resistance was met after a higher low and above 0.618 Fib. While this is a confirmed resistance zone, market conditions are bullish.
The RSI is now above 50. It is at its highest on a rise since late January earlier this year.
Local resistance on the RSI has been broken and this oscillator is trading straight up. This is a positive and strong signal. Here is the chart:
The yellow horizontal line is the local resistance which has been broken. On a drop, this same line would now work as support. A "magic" line I should say. :D
It is magical because it helps us predict the future with a high level of accuracy and certainty; so far so good.
These dynamics: The higher low, the small stop at resistance, the bullish RSI and overall bullish market conditions are all part of a bullish consolidation period.
Let me break it down for you; the market will continue to consolidate for a while, for as long as it needs, before moving higher to hit a new high. The conditions revealed by this chart setup is that the low that was hit 7-April remains the bottom. The market can shake, NVDA can go down, it can go up but this low will never be challenged, you can set your stop-loss below it. Any short-term movements against you is just noise. Wait patiently and eventually it will grow.
If you have any questions leave a comment it will be my pleasure to answer.
Thank you for reading again.
See you tomorrow, or the next day, or yesterday-more again.
Make sure to follow. My main focus is Cryptocurrency but I also do the SPX, NVDA and TSLA. (And sometimes Gold which is bearish now.)
Namaste.

Nvidia Shows Signs of Recovery -but the Bearish Channel Remains Over the last five trading sessions, Nvidia’s stock has gained more than 9%, and short-term bullish momentum remains intact as the tech giant appears to benefit from expectations of a potential easing in trade war tariffs. Notably, the company’s CEO, Jensen Huang, recently stated that the Chinese market for artificial intelligence chips could reach $50 billion within the next two years — highlighting the importance of maintaining access to this market. This reinforces the view that a diplomatic resolution to the trade conflict is crucial for Nvidia to sustain a steady recovery.
It’s also important to note that Nvidia is scheduled to release its next earnings report on May 28, with market expectations pointing to earnings of approximately $0.88 per share. Should results meet or exceed projections, this could reignite a bullish sentiment that has been largely absent from the stock over the past several months.
Bearish channel still in play:
Since early January of this year, Nvidia’s stock has formed a steady downward channel, pushing the price even below the $100 mark at times. While a consistent upward correction is underway, it remains insufficient to confirm a definitive breakout, meaning this bearish channel is still the dominant technical structure in the short term.
ADX:
The ADX indicator has been fluctuating below the neutral 20 level, signaling a decline in volatility over the average of the last 14 sessions. As long as this continues, the current phase of price neutrality may persist.
RSI:
The RSI is showing a similar picture, hovering near the 50 level — indicating a balance between buying and selling momentum in recent sessions, and reinforcing the lack of a clear short-term trend.
Key levels to watch:
$113: Current resistance level, aligned with the upper bound of the bearish channel and the 50-period simple moving average. Continued price action in this area may extend the current phase of consolidation.
$125: A critical resistance point tied to the 200-period simple moving average. A breakout toward this level could signal the end of the bearish channel.
$100: A key psychological support level in the short term. A move below this threshold could reinforce the bearish bias and trigger a deeper downtrend within the current price structure.
Written by Julian Pineda, CFA – Market Analyst

NVDA Looks Ready to Pop – Here’s What I’m Watching 👀
Alright, I’ve been eyeing NVDA this week, and the setup is actually pretty clean across multiple timeframes. Let me break down what I’m seeing and what I’m thinking going into the next few sessions.
🧠 My Thought Process
So on the daily, NVDA’s been slowly crawling its way up underneath this big descending trendline. It hasn’t broken out yet, but the way it’s holding higher lows and pressing toward the top of that wedge tells me it’s gearing up. MACD’s starting to curl up, Stoch RSI is lifting — I just get the sense this thing doesn’t want to stay boxed in much longer.
I zoomed into the 1-hour, and you can see it’s still respecting that upward trendline. Price pulled back a bit but didn’t break structure — in fact, it bounced and started reclaiming some levels fast. 114–115 is the zone I’m watching. If we clear that with some conviction, I’m leaning bullish for a quick move toward 117–119.
📊 Options Flow / GEX View
Now this part gets interesting. GEX is showing some heavy call interest around 115, and that’s where we’re hovering right now. If we push above and hold, the next big call wall sits at 119, and then you’ve got the Gamma Resistance wall at 120 — that could trigger a fast pop if market makers have to start hedging aggressively.
On the flip side, HVL is at 110, so if we reject again at 115, we might get a flush down toward that level.
🛠️ How I’m Thinking About Trading It
If we break and hold over 115
→ I’ll consider grabbing some short-dated calls (maybe 117c or 119c for this week), but I’ll only size in if volume confirms.
→ Also might just scalp commons for a move to 118–120.
→ Stop would be below 112.5 or the 1H trendline.
If we reject 115 and lose 113
→ I’ll wait for confirmation, but I’d consider puts targeting that 110 HVL level. Not gonna force it though — want to see the trend shift first.
Final Thoughts
Not trying to front-run this — just letting the levels play out. But NVDA is in a pressure cooker, and it won’t stay quiet for long. I’ll be watching that 115 level closely. Above it, I’m bullish with targets at 117–119. If it stalls, I’ll sit back and wait to see if it gives a better entry off a pullback.
Let me know if you’re trading this too or seeing something different. Always down to compare notes.
Not financial advice — just walking through what I’m seeing and how I’d play it.

NVDA UP -MY MVP SYSTEM-
Momentum: NVDA has been moving in a down sloping pattern; it is now breaking out to the upside
Volume: vol spike when price dipped below the downtrend line (looks like a Wykoff spring); some overall inc vol lately
Price: it is <200ma, so caution is warranted; can’t rule out this downward channel as a possible bull flag; it’s a pretty clean move
*I don’t trade NVDA. I use it as a major market indicator. Over the past 1-2wks, my alerts went off for ES, NQ, and RTY - all to the upside. It would be nice to see gold move down for more confirmation that big $ is shifting into indices.
*The RSI is still around 50 and could definitely fake to the upside & then slice all the way down through the triangle.
*Weekly & Monthly charts still show a major break in the indices. This move up does not look like a resumption of a bull trend. A lot of repair would be needed on the long term charts for that.

NVDA eyes on $105: Support for one last DIP before new highs?Followup to my warning about $113.56 (click)
NVDA back to the Golden Genesis Fib, a major landmark.
If we are to see one more dip from here, look for $105.08
If we continue then lookout for the Golden Covid at $122.25
.
Big picture view showing the $113.56 Golden Genesis
=======================================================

My buy view for NVIDIA stock explained My buy view for NVDA.
If positive fundamentals continue to outweigh bad news, we are likely to see NVDA push further up towards $120, $130, $140, and then its previous peak of $150.
Trade with care if you are day trading, but this baby is still selling at discount in my view

Flag like structure 2WPrice is consolidating in a downward channel or flag like structure; a bullish breakout can lead to price reaching to 134.85 price range,and a bearish breakout to price reaching 97.44 price range. Notice price is also between the 10 EMA in blue above and the 50 EMA in purple below. CCI is slowly returning from oversold territory. Stochastic RSI had a bullish crossover in oversold region. RSI is neutral. Price is also building up pressure in the Fibonacci golden zone.

Nvidia May Be Fighting HigherNvidia has been rebounding along with the broader market, and some traders may think it’s getting ready to accelerate.
The first pattern on today’s chart is the April 9 high of $115.10. The chip giant has challenged that level in the last two sessions. A close above that resistance may be viewed as confirmation of a breakout.
Second is the series of lower highs since mid-February. NVDA closed above that falling trendline yesterday and remains above it today.
Third, MACD has turned higher.
Finally, NVDA is a highly active underlier in the options market. (It averages 3.9 million contracts per day ranks first in the S&P 500, according to TradeStation data.) That could help traders take positions with calls and puts.
TradeStation has, for decades, advanced the trading industry, providing access to stocks, options and futures. If you're born to trade, we could be for you. See our Overview for more.
Past performance, whether actual or indicated by historical tests of strategies, is no guarantee of future performance or success. There is a possibility that you may sustain a loss equal to or greater than your entire investment regardless of which asset class you trade (equities, options or futures); therefore, you should not invest or risk money that you cannot afford to lose. Online trading is not suitable for all investors. View the document titled Characteristics and Risks of Standardized Options at www.TradeStation.com . Before trading any asset class, customers must read the relevant risk disclosure statements on www.TradeStation.com . System access and trade placement and execution may be delayed or fail due to market volatility and volume, quote delays, system and software errors, Internet traffic, outages and other factors.
Securities and futures trading is offered to self-directed customers by TradeStation Securities, Inc., a broker-dealer registered with the Securities and Exchange Commission and a futures commission merchant licensed with the Commodity Futures Trading Commission). TradeStation Securities is a member of the Financial Industry Regulatory Authority, the National Futures Association, and a number of exchanges.
Options trading is not suitable for all investors. Your TradeStation Securities’ account application to trade options will be considered and approved or disapproved based on all relevant factors, including your trading experience. See www.TradeStation.com . Visit www.TradeStation.com for full details on the costs and fees associated with options.
Margin trading involves risks, and it is important that you fully understand those risks before trading on margin. The Margin Disclosure Statement outlines many of those risks, including that you can lose more funds than you deposit in your margin account; your brokerage firm can force the sale of securities in your account; your brokerage firm can sell your securities without contacting you; and you are not entitled to an extension of time on a margin call. Review the Margin Disclosure Statement at www.TradeStation.com .
TradeStation Securities, Inc. and TradeStation Technologies, Inc. are each wholly owned subsidiaries of TradeStation Group, Inc., both operating, and providing products and services, under the TradeStation brand and trademark. When applying for, or purchasing, accounts, subscriptions, products and services, it is important that you know which company you will be dealing with. Visit www.TradeStation.com for further important information explaining what this means.

NVDA watch $113.56: Golden Genesis fib and Most Important level NVDA has come back to its "Golden Genesis" fib.
We had a high apogee orbit and have returned.
What happens here will determine the trend.
It is PROBABLE that we orbit this a few times.
It is POSSIBLE that we reject to the fib below.
It is PLAUSIBLE that we break to next fib above.
==========================================

NVDA: Should I Pull The Trigger ?Stock analysis coming this week from various sources saying "Time to Pull The Trigger on NVDA" .. Is it ?
Let's take a quick look ..
- NVDA has recently formed the famous VCP (Volatility Contraction Pattern) - a good sign for a possible breakout soon
- but the VCP is forming below the 50SMA (blue) and 100SMA(gray) lines
- also there's a "supply pocket" (white rectangle) forming a resistance area at $115
- the good sign is, yesterday (on hype from GOOG and MSFT earnings, NVDA finally broke towards the 50SMA and looks like trying to get above) - first time since wk4 Feb
So when is the ideal entry? what do i need to see ?
=====================================
- Price needs to get above the 50SMA (blue Line) - Which will cause the MACD main line to get into positive zone
- 20SMA (purple line) gets above 50SMA (blue line)
- Ideally price breaks above the 2 pivot levels marked on the chart $115 and $123
- The US market needs to stabilize for all of this to happen :)
- Note: NVDA analysts (upside) price targets are between $160 (avg) to $236 (highest) - See NVDA forecast page in TV. So patience should be rewarded. Let's get to the safe zone first.
thoughts ?

NVIDIA Massive bullish break-out after 4 months of selling.NVIDIA Corporation (NVDA) made a critical bullish break-out yesterday (in the aftermath of Meta's and Microsoft AI capex numbers) as it didn't just break above the 1D MA50 (blue trend-line) that has been intact as a Resistance since February 27 but also above the top of the Channel Down that has been the dominant pattern throughout this correction since the January 07 All Time High (ATH).
The 1D RSI is on an Inverse Head and Shoulders (IH&S) pattern, which is always bullish and if NVDA closes a 1D candle above the 1D MA50 next, then our short-term Target will be 143.50, which is just below Resistance 1 and the 2.0 Fibonacci extension.
-------------------------------------------------------------------------------
** Please LIKE 👍, FOLLOW ✅, SHARE 🙌 and COMMENT ✍ if you enjoy this idea! Also share your ideas and charts in the comments section below! This is best way to keep it relevant, support us, keep the content here free and allow the idea to reach as many people as possible. **
-------------------------------------------------------------------------------
💸💸💸💸💸💸
👇 👇 👇 👇 👇 👇

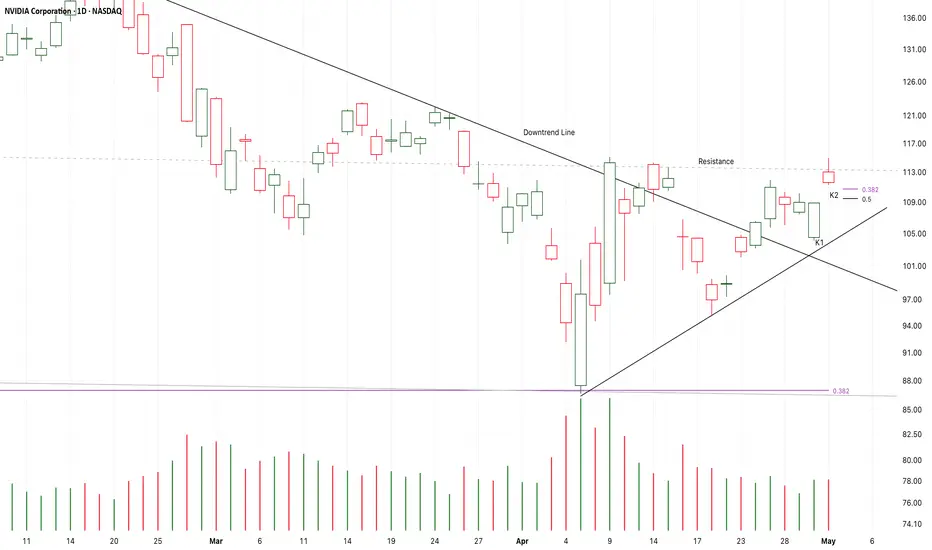
Chart Pattern Analysis Of NVDA
The recent several candles is a consolidation along the resistance.
And the supply pressure keeps at low level.
K1 is a bullish candle and it is also a potential right shoulder of a larger scale bullish head-shoulder pattern.
If the following candles close upon K2,
It is likely that another bull run will start here to test 125USD area.
On the other hand,
If K3 close below the bull gap at K2,
The risk will increase.
Long-110.5/Stop-109/Target-125
NVDA LTFLocal price action - the gap from 4/29 was filled in, but it left another gap on 4/30. During aftermarket hours, the price jumped up and approached the weekly level above but got rejected and finished the day red. We got a naked untapped pivot point below along with the range POC point of control.. not a bad week of price action.
From a range perspective price deviated to both sides and finisheded the day seemingly falling back into range. Let's see how the week ends.

NVDA Day Trade Plan for 04/29/2025NVDA Day Trade Plan for 04/29/2025
📈 111.90 109.90
📉 105.90 103.90
Thanks to all my followers! Truly appreciate the support!
Please like and share for more ES/NQ levels Tues & Thurs 🤓📈📉🎯💰
*These levels are derived from comprehensive backtesting and research and a quantitative system demonstrating high accuracy. This statistical foundation suggests that price movements are likely to exceed initial estimates.*

Nvda low time frameLocal price action - the gap from 4/29 was filled in, but another was left on 4/30. During aftermarket hours the price jumped up to approach the weekly level above and dropped back down. We got a naked untapped pivot point below along with the range POC point of control, not a bad week of price action.

How much money do I have? My real investment portfolioI’ve decided to start sharing my trades in a live-report format. What you see here is my actual portfolio — no fluff. Just the stock and crypto markets.
📊 Key Stats:
• 💰 Total across brokerage accounts: $22,167
• 📈 Profit since I started investing in 2020: $12,803
• ⚖️ Return: Around 60% total, with an average annual return of ~19%
📦 Portfolio Breakdown:
🧠 Top Performer — Nvidia
• Open positions: 6 shares
• Total profit including closed positions: $4,202
⚛️ Bet on Quantum Tech
• Holdings: QBTS and IONQ
• Long-term play with high potential
📈 Index Funds — Not a Priority
• Profit over 5 years: $523
• No open positions currently
🧨 Options — My Favourite Tool
• Total profit: $2,646
• Currently 2 open positions:
• NVDA 21NOV25 110P (sold put)
• AMD 21NOV25 80P (sold put)
If you would like to get nice overview in analytical platform drop a comment

What Is Dollar-Cost Averaging (DCA) in Investing and Trading?What Is Dollar-Cost Averaging (DCA) in Investing and Trading?
Dollar-cost averaging (DCA) is a popular strategy used by investors and traders to manage market fluctuations and build positions over time. Instead of trying to time the market, DCA focuses on consistent, regular investments regardless of price movements. This article answers “What is DCA?”, its advantages and limitations, and how it can be applied in both investing and trading.
What Is Dollar-Cost Averaging (DCA)?
So what is DCA investing? Dollar-cost averaging (DCA) is a strategy that involves consistently investing a fixed sum at regular intervals, regardless of the asset’s current price. This approach helps distribute the cost of purchases over time, potentially reducing the impact of short-term price fluctuations. Instead of trying to time the market perfectly—a challenging task even for experienced traders—a dollar-cost averaging strategy focuses on regular contributions to average the cost of assets.
This method offers a straightforward, disciplined strategy for both long-term investors and traders who wish to build or adjust positions gradually. By spreading out purchases, a DCA strategy may help mitigate the effects of market volatility. For example, during a period of market decline, the fixed investment buys more units at a lower cost, which could result in higher returns when prices recover. Conversely, during a sustained rise, the investor buys fewer units, which helps avoid overexposure. For example, if you invest $50 every week and the market is rising, you will buy fewer stocks, but when the market is moving down, you will buy more with the same amount.
What does DCA mean for market participants? DCA is particularly useful in uncertain economic environments where price swings are common. It provides a systematic approach to entering the market, removing the need to make snap decisions based on short-term market movements, and fostering a steady accumulation of assets over time.
How Does DCA Work?
DCA investing operates by establishing a regular schedule for investing a set amount of money into a chosen asset, regardless of its current market price. Instead of waiting for a particular price or market condition, funds are allocated at consistent intervals—be it weekly, monthly, or quarterly. Over time, this means buying more units when prices are lower and fewer units when prices are higher, resulting in an average purchase price that can be lower than if the investment was made in one lump sum.
Consider an investor using DCA. They commit £100 every month to buy company shares. In the first month, the share price is £20, so they purchase 5 shares. The next month, the price drops to £10, allowing them to buy 10 shares with the same £100. In the third month, the price rises to £25, and they purchase 4 shares.
Over three months, the investor has spent £300 and acquired 19 shares in total. To calculate the average cost per share, divide £300 by 19, which equals approximately £15.79 per share. This average is lower than the highest price paid and reflects the effect of buying more shares when prices are low and fewer when prices are high.
DCA also simplifies the process of entering the market. By adhering to a set timetable, investors bypass the need for constant market analysis, making it particularly appealing for those who prefer a more hands-off strategy. This systematic approach can be applied not only to traditional investments like shares and funds but also to other assets that traders and investors engage with.
DCA in Trading
DCA isn't just for long-term investors; traders can also employ it to navigate the ups and downs of fast-moving markets. By spreading out their entries or exits, traders may potentially lower the average cost of a position or build on a winning trend, all while managing their exposure to volatile moves.
Lowering the Average Price
For traders facing a position that's moving against them, DCA offers a way to adjust the average entry cost. By allocating additional funds, the average price of the position may be reduced. This approach can create a potential opportunity to exit with better returns if the market reverses. However, it is important to note that this method also increases exposure, and additional entities might compound losses if the trend continues.
Adding to a Winner
Conversely, traders may apply DCA to increase their positions when an asset shows strength. By gradually adding to an effective trade, the overall exposure is built in a controlled manner, potentially capturing further movement without committing all capital at once. This method is particularly popular in markets where momentum builds slowly, allowing traders to gradually take advantage of the sustained trend.
Applications Across Markets
Using DCA in stocks can help manage entries during periods of volatility, especially when market sentiment shifts rapidly. Forex traders often use similar techniques to adjust positions in response to fluctuating currency pairs, while the high volatility seen in crypto* markets makes DCA an appealing strategy for building positions gradually.
When using DCA in trading, a disciplined approach is essential. Whether lowering the average cost in a losing position or building on an effective trade, traders should carefully consider the additional risk that comes with increased exposure.
Advantages of Dollar-Cost Averaging
Dollar-cost averaging offers a range of advantages that make it an attractive strategy for both investors and traders, especially when navigating uncertain markets.
Mitigating Market Volatility
By investing a fixed amount at regular intervals, DCA spreads out exposure over time. This approach can reduce the impact of sudden market swings. Instead of being affected by a one-off high price, the average cost is spread across different market conditions. This may help stabilise entry points and smooth out short-term volatility.
Disciplined Investment Approach
DCA promotes a structured investment routine. With regular contributions, there is less temptation to try timing the market. This disciplined approach might be particularly useful when markets are highly volatile or ahead of news and economic events. It encourages systematic investing, reducing the likelihood of making impulsive decisions driven by market noise.
Accessibility for All Traders
DCA does not require intricate market analysis or deep expertise in market timing. Its straightforward nature makes it appealing to both newcomers and seasoned traders looking for a simpler method to build positions over time. By providing a clear framework, DCA allows traders to focus on long-term goals without the pressure of constant market monitoring.
Limitations of Dollar-Cost Averaging
While dollar-cost averaging offers a structured approach to investing and trading, there are some limitations to consider.
Potential Opportunity Cost
Spreading out investments means funds are gradually deployed over time. In a market that is consistent, waiting to invest might lead to missed returns compared to committing all funds upfront. This method can reduce the impact of volatility but might underperform during extended trends.
Continued Exposure to Market Trends
Investors remain exposed to the market throughout the investment period. If the market experiences a prolonged trend, regular investments will accumulate at better prices, but overall returns may still suffer. This approach does not eliminate market risk and requires a long-term perspective to potentially see a turnaround.
Dependence on Consistency
The effectiveness of dollar-cost averaging relies heavily on maintaining a consistent investment schedule. Any interruption or inconsistency can dilute the intended advantages of the strategy. It also assumes that investors are able to commit regular funds, which may not be feasible in all financial situations.
Comparing DCA to Lump-Sum Investing
Comparing DCA to lump-sum investing offers insights into different approaches to managing market exposure and returns.
Risk Exposure
Lump-sum investing involves placing all available funds into an asset at once. This method can yield higher returns if the market moves in their favour, but it also exposes the investor to immediate risk if the market moves against them. In contrast, risk is spread over time through a dollar-cost average, meaning regular investments reduce the likelihood of entering the market at a high point and potentially lowering the overall average cost.
Market Conditions
The performance of each approach can vary depending on market trends. In steady trends, lump-sum investing may capture more returns since all funds are deployed early. However, in volatile or declining conditions, DCA could mitigate the effects of short-term fluctuations by smoothing out entry prices over time.
Flexibility and Commitment
Lump-sum investing requires confidence and a readiness to commit all funds immediately. DCA, on the other hand, offers a more measured entry into the market. This method is popular among those who prefer a systematic approach and might not have a large sum available at one time.
The Bottom Line
Understanding the dollar-cost averaging definition can help investors and traders potentially manage market volatility and reduce emotional decision-making. While it has its limitations, DCA can be an effective strategy for building positions over time.
FAQ
What Is an Example of Dollar-Cost Averaging?
Imagine investing £100 into a stock every month, regardless of its price. In January, the stock costs £20, so you buy five shares. In February, the price drops to £10, allowing you to buy 10 shares. In March, the price rises to £25, and you buy four shares. Over three months, you’ve invested £300 and purchased 19 shares, averaging out your cost per share to £15.79.
Is There the Best Dollar-Cost Averaging Strategy?
The most effective DCA strategy depends on individual goals. A consistent, long-term approach with regular investments—whether weekly or monthly—may help smooth out market volatility. Focusing on diversified assets could also reduce risk exposure.
What Is the Daily DCA Strategy?
This strategy involves investing a fixed amount every day through DCA, meaning it may help minimise the impact of short-term price fluctuations in volatile markets. However, it requires careful planning due to frequent transactions and potential fees.
Does Dollar-Cost Averaging Work With Stocks?
Yes, DCA is commonly used with stocks. It may help manage the effects of market volatility, allowing investors to build positions over time without worrying about short-term price swings.
What Does DCA Mean in Stocks?
DCA, or dollar-cost averaging, in stocks, means regularly investing a fixed amount, regardless of price, to average out the cost per share over time and manage market volatility. A similar answer is true for “What does DCA mean in crypto*?”, except it would involve a regular fixed investment in a particular cryptocurrency*.
How to Calculate DCA in Crypto* Investing?
There is a simple formula to calculate DCA, meaning in crypto*, an investor would just divide the total amount invested by the total number of units purchased. This provides the average cost per unit over time, regardless of price fluctuations.
*Important: At FXOpen UK, Cryptocurrency trading via CFDs is only available to our Professional clients. They are not available for trading by Retail clients. To find out more information about how this may affect you, please get in touch with our team.
This article represents the opinion of the Companies operating under the FXOpen brand only. It is not to be construed as an offer, solicitation, or recommendation with respect to products and services provided by the Companies operating under the FXOpen brand, nor is it to be considered financial advice.

NVDA Rallying After Trump Roundtable – Will the Momentum Hold? 💥Today’s rally in NASDAQ:NVDA got a little extra fuel after CEO Jensen Huang spoke at Trump’s investor roundtable. From what I’m seeing on the chart, the market liked it—at least in the short term.
Let me walk you through what I’m thinking as I line up the Daily vs. 1H timeframes and weigh that against options sentiment from the GEX chart.
🕰 Daily Chart View:
Price is trying to recover inside a downtrend channel, and today’s candle is testing the breakdown zone around $110–113. Momentum is definitely building, with MACD ticking higher and Stoch RSI pushing into bullish territory. But... we’re still technically below a key breakdown trendline (starting from the $150+ level), so bulls need continuation soon or it risks another fade.
⏱ 1H Chart Analysis:
The 1-hour chart looks a lot more bullish than the daily. After breaking through $107, NVDA exploded through key levels and is now pressing against $113.96 (GEX Gamma Wall) below. That’s also the highest net positive GEX level, so we could be entering a zone of dealer hedging that resists more upside unless flows get really aggressive.
You’ll also notice IVX is elevated (58.2), IVR is low (34.8), and GEX is neutral to slightly green. There’s a CALL-heavy structure forming up to $115, with the market currently coiling beneath it.
🔁 My Thought Process:
I think the CEO's participation in the Trump investor meeting gave institutions some reassurance, and that may explain the sharp bounce from $107. However, unless we can hold above $114 and squeeze into $115–$117, I see this as more of a trader’s move than a longer-term breakout just yet.
🎯 Trade Setup Idea:
* For Calls: Wait for a clean break above $114 → potential target zone: $117–120. Stops below $110.
* For Puts: If price fails again near $113.50–114 and we see weakness into the afternoon, watch for $110 → $107 retrace.
* Neutral: If we chop under the Gamma Wall and IV remains high, premiums may decay fast — sit out unless a clean direction emerges.
🧠 Final Thoughts:
I’ll stay flexible. GEX shows us $113.96 is the tug-of-war zone right now, and if bulls can reclaim and hold above it with volume, we could shift toward a gamma squeeze. But I’m also aware it might be a fade if the momentum stalls now that the Trump headline is digested.
Disclaimer: This post is for educational purposes only and not financial advice. Always do your own research and manage your risk.

NVDA - BullishForecast a break-out up as the price increased by 3.3% in the after hours.
- The price area in a falling wedge, almost a descending channel.
- The MACD indicator in the Weekly frame shows an uptrend after a rare day of oversold (04.04.2025).
The price today (04.30.2025): $108.92.
Price target: $135.00.
Stop loss: $95.00.
IMO, amateur trader.
