NVDA trade ideas

NVDIA Short to T1 2 Setups here.
- Both T1 and T2 will be hit as part of my price return to zero system (inflexion points).
- I'm shorting to T1 first and then reverse into long for T2. If it heads to T2 first I'll simply stay in my original T1 short for the duration.
It is of course easy to say that this will either go up or down :-). My system defines targets and there is no rules to say that can only produce a target in one direction. Based on what I see I know with around 95% accuracy that it will hit both with a reasonable timescale. I just don't know which one comes first :).
Either way I'm shorting to T1 in the first instance. It may hit T2 first but that doesn't bother my trading as I still expect T1. I won't go down the route of a martingale to T! if it goes to T2 first!! that's just asking for trouble regardless of confidence levels!

Nvidia - The Chart Just Told Us So!Nvidia ( NASDAQ:NVDA ) might just still head a little lower:
Click chart above to see the detailed analysis👆🏻
After Nvidia perfectly retested the previous rising channel resistance just a couple of months ago, it was quite expected that we'll see a retracement. The overall trend however still remains bullish and if Nvidia drops a little more, the overall bullrun continuation rally might just follow.
Levels to watch: $80
Keep your long term vision,
Philip (BasicTrading)

cup with handle pattern on the 1-hour time frameWelcome to today's analysis! Let’s break down the current price action on NASDAQ:NVDA and potential trade setups.
🌐 Overview: NASDAQ:NVDA Forming a Cup with Handle Pattern
📈 NASDAQ:NVDA is currently forming a cup with handle pattern on the 1-hour time frame. This pattern is typically bullish and could indicate a potential upward move.
🔄 Current Scenario:
NASDAQ:NVDA has formed a cup shape and is now developing the handle. The handle is a consolidation phase before a potential breakout.
The key level to watch is the resistance at the top of the handle. A breakout above this level could signal a bullish continuation.
🔑 Key Levels to Watch
🔴 Resistance: Top of the Handle (Needs breakout for continuation)
🟢 Target: Measured move equal to the depth of the cup, projected from the breakout point.
🛠️ Trade Scenarios
📌 Bullish Scenario (Breakout Above Resistance)
If NASDAQ:NVDA breaks and holds above the handle resistance, it could move toward the target level.
This breakout would confirm the cup with handle pattern and suggest a potential upward trend.
📌 Bearish Scenario (Failure to Breakout)
If NASDAQ:NVDA fails to break out and instead moves lower, it could retest the support levels within the cup or handle.
A failure to hold above key support levels could indicate a potential reversal or further consolidation.
📌 Conclusion
NASDAQ:NVDA is forming a cup with handle pattern on the 1-hour time frame. A breakout above the handle resistance could signal a bullish move toward the target level. If the price fails to break out, further consolidation or a retest of support levels may be necessary.

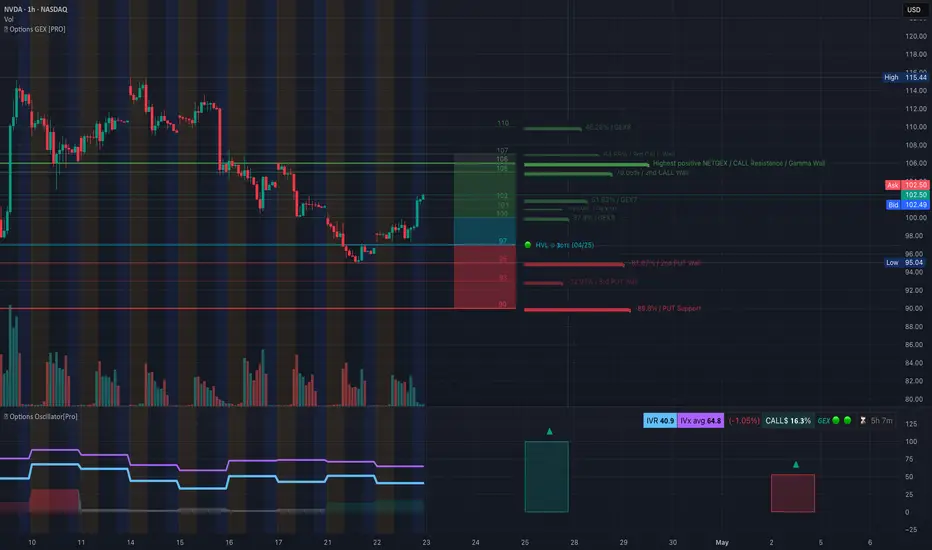
NVDA Options GEX + Trade Forecast – April 23, 2025🔍 GEX Options Overview:
NVDA is experiencing a clear options-driven magnet toward 105–106, with notable call wall concentration and positive NET GEX at those levels:
* Highest positive GEX zone: 105–106 = bullish gamma magnet
* HVL for 3DTE anchored at 97 = strong bounce zone
* PUT walls stacked at 95, 93, 90 showing limited downside support but weakening pressure
* Options Oscillator confirms this bullish lean with green GEX dots, low IVX, and relatively low IVR (40.9)
Despite the macro softness, NVDA has gamma fuel to push up, especially with no strong call resistance until the 105–107 zone. This sets up a favorable risk/reward setup for short-term bullish trades.
📈 Technical Analysis & Trading Outlook:
From the SMC Co-Pilot chart, NVDA is rebounding after forming multiple BOS (Break of Structure) signals and is now consolidating under a previous CHoCH level, near the 102–103 zone.
* Trend Bias (MTF): 30m & 15m bullish, but 1h still recovering
* HTF Structure: Bullish SMC structure forming, but caution is required
* Volume: Extreme spike (1.6x) during reversal = institutions may be stepping in
* Setup Status: No trade confirmed yet – but we are in premium zone, so shorts are risky unless structure shifts
* EMA21 is the decision zone; price reclaiming and holding above would confirm further upside
🧠 My Thoughts:
This is one of those setups where the GEX setup is leading price, and technicals are just beginning to catch up. The move from 97 to 102 was gamma-fueled, and any dip toward 100 or 98 may provide high R/R re-entry zones for CALL scalps or spreads.
No trade now unless we get either:
1. A clean pullback to 99–100 and bounce with confirmation (BOS/CHoCH + volume support)
2. Break and hold above 103.5 with strength — then scalp to 106
⚠️ Avoid chasing at highs without confirmation. Volume and structure will decide whether this is a dead cat bounce or start of a new leg up.
This analysis is for educational purposes only. Always trade with a plan and proper risk management.
NVIDIA: From $300B to $3T – Is the Pullback a Setup?Between October 2022 and mid-2024, Nvidia's market capitalization surged from $300 billion to over $3 trillion — a tenfold increase that outpaced the GDP of entire nations such as Russia or Canada. This meteoric rise made Nvidia the largest public company in the world at one point.
A long-term investment in NVDA has dramatically outperformed the broader market. From May 2014 to May 2024, the stock gained over 22,000%, compared to 179% for the S&P 500 and 77% for gold.
However, in 2025, Nvidia stock declined by 43%, raising the question: does this mark the end of the rally or the beginning of a new accumulation phase?
Core Drivers
AI dominance: Nvidia controls 95% of the GPU market used in machine learning applications.
Strategic clients: Tesla, Meta, Microsoft, and Alphabet continue to deepen partnerships with NVDA.
Crypto leverage: The company holds 82% of the GPU market used for mining, benefiting from the renewed crypto upcycle.
Domestic production push: Nvidia is developing over 1 million square feet of manufacturing space in Arizona and Texas, aiming to produce $500B worth of AI infrastructure over the next four years.
Policy support: The US and EU are investing more than $240B to secure domestic chip production via the CHIPS Acts.
Financial Strength
FY2024 revenue grew 114% YoY to $130.5B
Q4 net income reached $22B
Nvidia joined the Dow Jones Industrial Average in late 2024
Announced a $50B buyback program
Executed a 10-for-1 stock split in June 2024
Trading View
After peaking in 2024, NVDA retraced to the $110 area, which now acts as a potential accumulation zone. The next major resistance lies near $150, offering a 35% upside if momentum returns.
The macro backdrop remains highly favorable — AI infrastructure investment continues to accelerate, and the recent correction may reflect short-term positioning rather than fundamental weakness.
Final Thoughts
Nvidia is no longer just a semiconductor company — it is a system-level platform powering the AI economy. With robust fundamentals, strategic expansion, and institutional demand, the current price levels could represent a key medium-term opportunity for trend-followers and long-term investors alike.
#NVDA #Nvidia #Semiconductors #AI #EquityMarkets #TradingViewIdeas

NVDA - DECENT CONFIRMATION Good Morning,
Seeing some strength in NVDA since yesterday. Trend is showing another strong movement upwards. There is a divergent volume profile since the original YTD low on April 7th 2025.
I feel a little like this is like taking candy from a baby, lets see what happens.
Enjoy!

simple chart of what I seeAnyone who knows me know I like to make simple charts that get to the point. Nothing fancy. Just lots of lines. Anyway, I did a ghost feed so you can get an idea of where I think we go from here. I seriously doubt we see any big changes until earnings. Unless China gets their heads out of the you know what, we will trade like this for a little while. I do feel there is hoppe. If NVIDIA has strong earnings , it could be enough push it to new highs. I would use caution. You will see by my chart we started off with an ascending wedge, moved right into a descending wedge and now I feel we will rinse and repeat. All the while ultimately creating new highs and new lows. Anywhere you see horizontal lines is where I see resistance. And yes, I do still think we could drop below 100 again, so get your buy fingers ready :) Not financial advice! Just an old trader's ideas. If we break above 130 before now and earnings, consider it could be a nice ride up!!

NVDIA Buy (CLOSE WATCH)Nvidia will be dropping to my range discussed on the chart due to short term inability to get license to provide H20 Processors to China. Earnings are releasing end of May and I predict positive news on that, perfect time to buy low.

Where is the Nvidia ball bouncing?Good afternoon, at 15:48 p.m Nvidia is looking towards the up side. A sell off took place over the weekend (great deals).A swing up at least $3 in an accumulation or quick move up is likely. Decent entries to look for adding a steady 5% to 10% in a few days in this high volatile climate.

NVDA Rounding Topping Pattern!I started warning about NASDAQ:NVDA back on Nov. 4th, 2024, and we all saw a healthy -30% decline since then.
Updating that chart reveals a rounding topping pattern in place. Despite the 30% collapse, the pattern remains as bearish as ever.
CAUTION is in order!

NVDA’s Wild Crash Alert: I’m Braced for a Heart-Stopping Drop!NVDA’s like a rocket losing altitude, and I’m on edge! It’s at $95.99, but I’m seeing it tumble to $90, maybe $88.95, then $83.59 if the bears go wild. If that breaks, whoa—$77.48 could hit hard! I’m glued to $90 for the first clue—big selling there, and it’s game on for a slide.
Kris/Mindbloome Exchange
Trade Smarter Live Better

Down Nearly -5.5% The Nvidia Death Cross. Formed and Diverging?!NVIDIA (NVDA) Looks to be showing a formed death cross of the 65 Day and 200 Day Exponential Moving Averages . Price is down almost -5.50% by Midday.
What could happen next?

NVDA Time For Bounce?Nvidia has been in a strict downtrend for the last few months, forming a constricting price action in the form of a falling wedge.
Generally, this can be seen as a bullish reversal pattern as "pressure" builds within the wedge before ultimately an explosive move.
I will look to take long trades here with a stop below the previous low with a 1H candle close as an invalidation.
Any potential good news can be a massive catalyst for the market, majorly Nvidia who has been a large target of trumps tariffs in relation to china.

Ride Nvidia’s AI Wave: Long-Term Promise Amid Short-Term Risks
- Key Insights: Nvidia faces near-term bearish pressures due to U.S.–China trade
tensions, AI chip export restrictions, and tariff challenges. However, it
remains the undisputed leader in AI infrastructure and GPU innovation,
positioning it for long-term growth. Entry points near critical support
levels may offer opportunities for patient investors to capitalize on its
leadership in AI-driven industries. A bullish reversal requires a breakout
above $104.75.
- Price Targets:
*Next Week Targets (Long Position)*
- T1: $103.25
- T2: $108.10
*Stop Levels*
- S1: $98.50
- S2: $94.75
- Recent Performance: Nvidia's stock has struggled within a bearish channel,
underperforming tech-heavy indices such as the Nasdaq, which have been
weighed down by sector-wide semiconductor weakness. The stock’s lower highs
and lower lows reinforce its short-term downside trajectory, amplified by
regulatory uncertainties and weakened demand from China. These factors have
contributed to gamma exposure-driven speculative price movements around the
$100 zone.
- Expert Analysis: Analysts highlight Nvidia's dominant position despite export
restrictions that may cost up to $5.5 billion. Nvidia continues to drive AI
innovation through its Kyber compute architecture and Dynamo software,
targeting industries like automotive and pharmaceuticals. While bearish
sentiment persists short term, long-term growth prospects remain robust due
to strong U.S. semiconductor policy support and widespread demand for AI
applications. Nvidia’s strategic positioning makes it a desirable asset for
long-term investors despite current macroeconomic risks.
- News Impact: Geopolitical tensions, specifically the Biden administration's
restrictions on advanced AI chip exports to China, remain pivotal for
Nvidia’s stock trajectory. These restrictions are expected to impact
Nvidia’s earnings through 2024. Additionally, escalating tariffs are adding
inflationary pressures, though efforts to negotiate market access highlight
Nvidia’s proactive approach to mitigating restrictions. Meanwhile, Nvidia’s
breakthroughs in AI technology continue to drive optimism for future growth
in multiple industries. Investors should remain vigilant as any easing of
trade restrictions could act as a significant upside catalyst.

We're seeing a nice box breakout NVDA | Bullish?We're seeing a nice box breakout here, which could indicate a good opportunity for a deeper correction. Therefore, we're setting the target at $91.5 and would continue moving lower until we see another box breakout in the opposite direction. Additionally, there is a major resistance level around the $91.5 zone, which will give us insight into how far NVDA's downtrend might go—or whether this could mark the turning point.

NVIDIA Daily Chart Update (04/19/2025)What's up, traders? Let's dive into NVIDIA's chart with the SmartTrend Indicator @tradingbauhaus giving us some solid insights.
Price Action: NVIDIA's been on a downward spiral since late March, sliding from ~$148 to $104.28. It's broken below the Ichimoku Cloud, which is a big bearish flag.
Ichimoku Cloud: Price is under the cloud, and it's turned red - bears are running the show. The lagging span (Chikou) is also below the price, doubling down on the downtrend.
Key Levels: We're testing support at ~$100 right now. If it breaks, $92 might be next. Resistance is up at the cloud base around $110.
SmartTrend Indicator @tradingbauhaus: This indicator's showing a strong bearish trend with a
Trend Strength of -16.4. Volatility's high at 387.76K, and the 24 High/Low is at -5.6, confirming the downtrend. Volume sentiment is neutral, though.
Signals: The SmartTrend Indicator @tradingbauhaus has been dropping red X's (sell signals) that align perfectly with the downtrend. A blue X (buy signal) popped up on April 17, hinting at a possible short-term bounce, but the overall trend still looks bearish.
Volume: We've seen big volume spikes on down days, showing strong selling pressure, though it's eased off a bit recently.
My Take: The SmartTrend Indicator @tradingbauhaus is leaning heavily bearish unless we break above the cloud at ~$110. Keep an eye on that $100 support – a bounce could happen, but if it cracks, $92 is in sight. What's your take, fam? Drop your thoughts below!

NVDA: Buy the Dip or Miss the Run?NVDA 💥🔥
Let’s be real, the market’s been shaky. Between the spike in volatility and the new tariff chatter coming out of the Trump camp, tech stocks are getting tossed around. But here’s the thing—volatility is where the setups live. And NVDA, sitting at the center of the AI revolution, isn’t going to stay down forever.
This might be the window. We’re talking a solid entry zone between 90 and 70, right where volatility meets opportunity.
Our profit targets?
✅ 110 for a clean bounce
✅ 125 as momentum builds
✅ 145+ if the bulls take the wheel again
It’s not about chasing—this is about timing the wave before it rips. So if you’re into smart risk, layered entries, and riding volatility like a pro… NVDA just rang the bell.
Disclaimer: This is not financial advice. All trading involves risk, especially in volatile conditions. Always do your own research or speak to a licensed financial advisor before making any trading decisions.

IM BEARISH ON NVIDIA WITH A TARGET OF $55.00. HERE IS WHY:NVIDIA (NVDA) Known for their GPUs, recently has experienced a decline in asset price. Trump tariff's may have been a bearish news catalyst, but do the technicals show a bigger bearish picture?
1 Day chart: While the RSI recently signaled oversold conditions, the RSI line looks to be crossing down the RSI based moving average. Furthermore the 200 Day EMA and 65 Day EMAs appear to be forming a death cross. DMI is still indicating bearish, and the ADX is still above 20.
With recent political news, the tech company has been working on bolstering their U.S based production. But with inflation cooling (6 month low) , I believe many high performing blue chip stocks may see a dip as traders and institutions price in deflation, new news and political events.
My opinion on a target is $55.00 , and there is significant open interest on long puts for this price that are expiring in the coming months.
Will NVIDIA pull out of this downtrend? Or will it become a great value buy for investors?
Disclaimer: Not financial advice.

NVDA range bound $100 to $120 for next two weeks NVDA range bound $100 to $120 for next two weeks
S1 S2 , R1 R2 Levels with 50 and 200 MA lines on 1 hour chart
for last one month since March Trading under 200 MA line (of 1 hour chart)

NVDA short trap may be set..!boost and follow for more! thanks ❤️🔥
Yesterday NVDA broke the trend support that's its held in this downtrend, but it quickly climbed back above.. was that drop the final short trap before the move higher?
it's trying to reclaim the pink support zone now, if it can and we cross 107, then the move higher to my upside targets is likely.🎯
side note: I added 110 weekly NVDA while it was in the 90s yesterday, they hit 100%+ gain this morning and I secured, but I will look to trade this again on the cross of 107 or so, for now I will put my focus elsewhere. GLTA ⚡

Nvidia: Bullish Monday?A new week is about to get started and we would like to know if the NVIDIA Corporation (NVDA) chart supports a bullish Monday.
What is the chart saying on the daily timeframe?
The chart has many positive signals and support a strong week but...
Good Sunday my fellow Cryptocurrency trader, how are you feeling in this wonderful day?
I hope you are doing great.
Let's read the chart; together, let's trade!
The chart looks really good and the short-term can always surprise, anything goes.
The chart is saying, "up, straight up," and even though the markets are unpredictable, I can easily tell you what the market is doing and is most likely to happen after the weekly close.
NVDA is super bullish and likely to continue growing based on multiple signals:
1) The falling wedge pattern is already confirmed. The action broke above it.
2) The trading volume supports a continuation of the pattern breakout.
3) The correction was really strong but the reaction to support was even stronger. Such a strong reaction indicates that traders were anxious and ready to buy. The only reason to sell was based on political bad news. With the bad news removed, up we go. NVDA is solid and with Bitcoin and mining growing, the market expanding, AI, NVDA is set to follow and also grow.
4) Both the 0.786 and 0.618 Fib. retracement levels are major support and gauge the strength of a stock. If the action is happening below, bearish; when the action happens above bullish. The fact that the action moved below just to recover makes this a strong bullish signal. A failed signal for the bears because they failed to move prices lower. A strong bullish signals for the bulls because the action is back above long-term critical support.
5) The session 10-April closed as a hammer and this also points up.
6) Finally, NVDA managed to close daily above EMA8, EMA13 and EMA21. Short-term bullish bias is now valid, active and confirmed.
All these are bullish signals saying that the market will move higher next.
What needs to happen for all this to become invalid?
NVDA would need to close daily below the last low.
No need to worry about short-term moves and noise. We are going up long-term.
The correction here reached more than 43%. Believe it or not, a 43% drop is a very strong drop. For the market to go lower, it would need to be the end of the company or worse. What need is there for a stock like this one, with a great product in huge demand, to drop by 80%, for what reason?
We are going up.
Namaste.

Chipmaker Stocks DeclinesChipmaker Stocks Declines
According to the charts, semiconductor stocks underperformed the broader equity market yesterday. While the S&P 500 index (US SPX 500 mini on FXOpen) fell by around 2.2%, the drop was far steeper across the chip sector:
→ The bullish semiconductor ETF (SOXL) declined by 15%;
→ Nvidia (NVDA) shares fell by 6.9%;
→ Advanced Micro Devices (AMD) dropped by 7.3%.
In other words, chipmaker stocks dragged down the broader market, raising concerns ahead of the upcoming earnings season.
Why Are Chip Stocks Falling?
The decline stems from corporate assessments of how the escalating global trade war and new tariffs could impact future performance.
According to media reports:
→ AMD expects to face tariffs of up to $800 million on exports to China;
→ For Nvidia, similar levies could exceed $5 billion.
Technical Analysis – Nvidia (NVDA)
The price continues to fluctuate within a downward channel, previously identified in our analysis:
The lower boundary of the channel is acting as support, helping the price close near its opening level yesterday (forming a Doji candle on the daily chart).
Technical Analysis – AMD
A similar picture is emerging on the AMD chart:
The $96 level now appears to be a key resistance zone.
In Summary
All eyes are on today’s earnings report from chipmaker TSMC (TSM), which could significantly influence the currently bearish sentiment in the sector.
This article represents the opinion of the Companies operating under the FXOpen brand only. It is not to be construed as an offer, solicitation, or recommendation with respect to products and services provided by the Companies operating under the FXOpen brand, nor is it to be considered financial advice.
