NVDA – Buy the Dip for a Short BounceOur last NASDAQ:NVDA trade went very well. Within a few weeks we made more than 15% re-testing the ATH and generating a new one. Directly after hitting the ATH we saw a sell on good news event during the CES and the presentation of the “Home AI PC”. The perfect time to buy was yesterday minutes before markets closed. The price formed a falling wedge with a RSI divergence. Nevertheless, buying today could still give results. Target is the ATH again and invalidation point is a close below our $140 support.
Target Zones
$154
Support Zones
$140
NVDA trade ideas

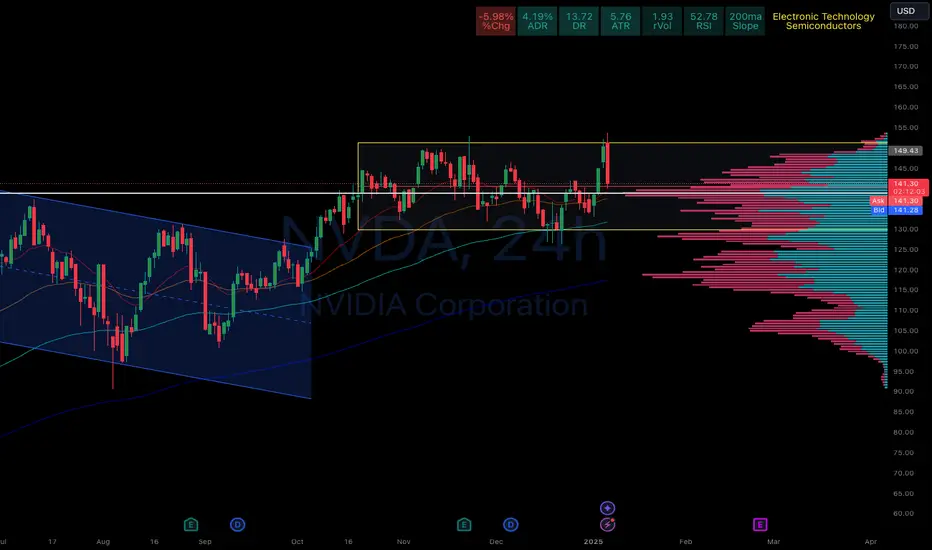
We might possibly see a brief bullish trend.The price is now falling back into the buying zone, indicating that we could see a brief bullish trend. We would enter with a 0.5% position upon reaching the buying zone and add another 0.5% position if the price holds above the resistance rather than falling below it. The take profit would be set at the target level. This setup could result in a good, short uptrend.

NVDA - A 90% Short fall to the centerline ($100-$104) or lowerDouble top, failed breakout of the high—call it what you will.
Fact is, NVIDIA has taken a brutal hit and is now trading back inside the fork.
Hagopian—what on earth is a HAGOPIAN?
According to the Fork Framework rulebook, if the market fails to reach its next target (the next line, such as the centerline, lower median line parallel, etc.), it reverses and moves further back than where it started.
This is (not so exactly) what happened in December. Instead of reaching the centerline, the market turned, shot beyond the upper median line parallel (U-MLH), and was supposed to break above the November 21st high. It missed that target as well. And this, my friends, is....?
...again, a HAGOPIAN!
Now, it’s heading south again. But this time, we have an over 90% probability of reaching the centerline. Why? Because when the market breaks above the U-MLH and then falls back into the fork, it’s a very bearish signal.
Of course, nothing works 100%. The market could turn around today and push past the high. But statistically, we’re aiming for the centerline—and there’s an over 90% chance we’ll hit it.
When will it happen?
Sorry, my crystal ball is broken.
All I do is follow the Fork/Median Line rulebook and rely on my experience.
As for me, I’m opening a short position in NVIDIA today and may add to it on the way down to the centerline. And I play this game with Options, so no hard price level stop for me.

NVIDIA $NVDA | FALL OF THE CHIP KING, WHO'S UP NEXT? - Dec22'24NVIDIA NASDAQ:NVDA | FALL OF THE CHIP KING, WHO'S UP NEXT? - Dec22'24
NASDAQ:NVDA BUY/LONG ZONE (GREEN): $136.25 - $149.00
NASDAQ:NVDA DO NOT TRADE/DNT ZONE (WHITE): $133.00 - $136.25 (can be extended to $127.25 - $136.25)
NASDAQ:NVDA SELL/SHORT ZONE (RED): $118.25 - $133.00 (can be extended to $118.25 - $127.25)
NASDAQ:NVDA Trends:
NASDAQ:NVDA Weekly Trend: Bullish
NASDAQ:NVDA Daily Trend: Bullish
NASDAQ:NVDA 4H Trend: Bearish
NASDAQ:NVDA 1H Trend: Bearish
NASDAQ:NVDA stock has been in a downtrend since their last earnings release on Nov20, who will become the next trillion-dollar chip maker? Trying a new style of analysis. Previously would erase the zones that I would reference in the past, but now I will include them, as I have been constantly updating my NASDAQ:NVDA analysis for other to use and follow along. After we saw the fall from the Nov20 earnings report, price pulled back to the previous price level the day of earnings release, before tumbling back into the bearish zones. The down trend has not been broken for NASDAQ:NVDA , but bulls should look for a break above 136.25 and bears should look for continuation below 133.00 or 127.25.
I will link below my previous NASDAQ:NVDA analysis, along with my NASDAQ:SMCI analysis and NASDAQ:AMD analysis!
This is what I would personally look at before entering trades, everything is subject to change on a daily basis and as I analyze different timeframes and ideas.
ENTERTAINMENT PURPOSES ONLY, NOT FINANCIAL ADVICE!
trendanalysis, trendtrading, priceaction, priceactiontrading, technicalindicators, supportandresistance, rangebreakout, rangebreakdown, rangetrading, chartpatterntrading, chartpatterns, spy, sp500, s&p, fed, federalreserve, fedrate, fedratecut, interestrate, jeromepowell, fedchair, 50bps, volatile, volatility, nvidia, nvidiapricetarget, nvdatrend, nvidiatrend, nvdasetup, nvidialongs, nvidiashorts, chipmakers, smci, amd, supermicro, advancedmicro, chipmakertrends, newchipmakers, trilliondollarchipmakers, nvidiaproducts, nvidiachips, nvdachips, nvdatrend, nvdaprice, nvidiaprice, nvidiaanalysis, nvidiasetups, nvdaideas,

$NVDA NVIDIA AFTER CES: REALITY KICKS IN AFTER ATH | JAN08'25NASDAQ:NVDA NVIDIA AFTER CES: REALITY KICKS IN AFTER ATH | JAN08'25
NASDAQ:NVDA BUY/LONG ZONE (GREEN): $140.00 - $153.00
NASDAQ:NVDA DO NOT TRADE/DNT ZONE (WHITE): $136.00 - $140.00
NASDAQ:NVDA SELL/SHORT ZONE (RED): $127.00 - $136.00
NASDAQ:NVDA Trends:
NASDAQ:NVDA Weekly Trend: Bullish
NASDAQ:NVDA Daily Trend: Bullish
NASDAQ:NVDA 4H Trend: Bearish
NASDAQ:NVDA 1H Trend: Bearish
At CES 2025, NASDAQ:NVDA unveiled a series of groundbreaking announcements, including the RTX 50 series GPUs and the Cosmos AI platform, aimed at robotics and autonomous vehicles. This led to an immediate surge in NASDAQ:NVDA 's stock price, hitting new all-time highs and reaching the top of my previous bullish zone. However, the excitement didn't last, with the stock experiencing a significant pullback shortly after.
I will link below my previous NASDAQ:NVDA analyses, along with my NASDAQ:SMCI analysis and NASDAQ:AMD analysis!
This is what I would personally look at before entering trades, everything is subject to change on a daily basis and as I analyze different timeframes and ideas.
ENTERTAINMENT PURPOSES ONLY, NOT FINANCIAL ADVICE!
trendanalysis, trendtrading, priceaction, priceactiontrading, technicalindicators, supportandresistance, rangebreakout, rangebreakdown, rangetrading, chartpatterntrading, chartpatterns, spy, sp500, s&p, fed, federalreserve, fedrate, fedratecut, interestrate, jeromepowell, fedchair, 50bps, volatile, volatility, nvidia, nvidiapricetarget, nvdatrend, nvidiatrend, nvdasetup, nvidialongs, nvidiashorts, chipmakers, smci, amd, supermicro, advancedmicro, chipmakertrends, newchipmakers, trilliondollarchipmakers, nvidiaproducts, nvidiachips, nvdachips, nvdatrend, nvdaprice, nvidiaprice, nvidiaanalysis, nvidiasetups, nvdaideas, ces, cesevent, cesnvda, cesnvidia, ces2025, cesamd, cessmci, cesrtx50, rtx50, gpus, cosmosai, newai, aitrends, newaiindustries, nvdaproducts, nvdartx, jensenhuang, nvdaceo, nvdajensenhuang, nvdaoptions, amdsmcinvda,

$NVDA, Long, Risk=1/5, TP>15%NASDAQ:NVDA , Long, Risk=1/5, TP>15%
Fundamentally the stock is good.
Choose an entry point and do not forget about a protective order if you are trading with leverage.
Don't risk it if you're not sure.
Good luck to everyone.

NVDA Technical Analysis and GEX Insights-Jan. 8
Technical Analysis (30-Minute and 1-Hour Chart)
* Trend and Price Action:
* NVDA experienced a sharp pullback after testing the $155.00 resistance level and is now consolidating around $141.50.
* The price is forming a potential descending triangle with immediate support at $139.00 and resistance at $144.00.
* Volume: The pullback is accompanied by a significant volume increase, signaling heavy selling pressure at higher levels.
* Indicators:
* MACD: Bearish crossover with increasing downward momentum, confirming the recent selloff.
* Stochastic RSI: Oversold conditions, suggesting the possibility of a short-term bounce.
* Key Levels:
* Support Levels:
* $139.00: Immediate support zone and a critical pivot for maintaining bullish sentiment.
* $136.00-$135.00: Major support levels aligned with high PUT wall activity, signaling strong downside protection.
* $125.50: Extended support level, marking the lower boundary of recent price action.
* Resistance Levels:
* $144.00: Immediate resistance zone with PUT walls above, adding to selling pressure.
* $150.00: Strong resistance backed by CALL wall activity.
* $155.00: Key resistance aligned with the highest positive gamma exposure.
GEX Insights for NVDA
* Gamma Exposure (GEX):
* Positive GEX Zones:
* $150.00-$155.00: Dominant CALL wall region, acting as significant resistance.
* $144.00: Additional resistance level with high gamma-related hedging activity.
* Negative GEX Zones:
* $139.00: Immediate PUT wall, marking strong short-term support.
* $136.00-$135.00: High negative gamma concentration, reinforcing downside support.
* Options Metrics:
* IVR (Implied Volatility Rank): 21%, indicating relatively low options pricing.
* Options Flow:
* CALLs: Concentrated at $144.00 and $150.00, reflecting resistance levels.
* PUTs: Heavy activity below $139.00, highlighting significant hedging and support.
Trade Scenarios:
Bullish Scenario:
* Entry: Above $144.50 with confirmation of breakout momentum.
* Target: $150.00 (initial), $155.00 (extended).
* Stop-Loss: Below $141.00 to limit downside risk.
Bearish Scenario:
* Entry: Below $138.50 with strong selling volume.
* Target: $135.00 (initial), $125.50 (extended).
* Stop-Loss: Above $141.00 to cap losses.
Conclusion
NVDA is currently consolidating near $141.50 after a steep pullback. A break below $139.00 could lead to further downside toward $135.00 or lower, while a breakout above $144.50 may trigger a move toward $150.00 or $155.00. GEX data confirms these levels as critical pivot points for price action and options-related activity.
Disclaimer: This analysis is for educational purposes only and does not constitute financial advice. Always conduct your own research and manage risk responsibly.
Let me know if you'd like further clarifications or insights!

Nvidia Stock Double Top Nvidia 📉 **Double Top Pattern in Technical Analysis** 📉
A **Double Top** is a bearish reversal pattern that signals a potential trend change from upward to downward. It forms after a strong uptrend and consists of two peaks at roughly the same price level, with a valley (or trough) in between.
🔍 **Key Characteristics**:
1. **First peak** – Price hits a high point and retraces.
2. **Second peak** – Price rises again but fails to surpass the first peak.
3. **Neckline break** – A drop below the trough confirms the pattern, signaling a potential downtrend.
🚨 **What it means**: When the price breaks below the neckline (the support level), traders may look for a sell signal, as the pattern suggests weakness and a possible reversal of the current uptrend.
#TechnicalAnalysis #DoubleTop #ChartPatterns #StockMarket #TrendReversal #TradingTips

NVDA Nvidia 24 hr potterbox.NVDA Nvidia. 24hr potterbox. Well as we can see from the box is that nivida could possibly bounce off of the 50 percent line or cost basis. $140.62ish If it doesnt stop there it will possiblt keep going down to the floor of the box. $129.91ish we shall see where it goes tomorrow. I also believe in the power of the threes. one ,two ,three, bam. Happy trading.
Nvidia (NVDA) Reversal Candle Within Bullish TrendChart Analysis:
NVIDIA has emerged from a consolidation phase, with a breakout signaling a potential continuation of its bullish trend.
1️⃣ Breakout Confirmation:
The stock broke out above the descending channel (green-shaded area) with strong bullish momentum, as highlighted by the long bullish candle (purple circle).
The breakout aligns with the broader ascending trendline (black line), reinforcing the bullish bias.
2️⃣ Key Moving Averages:
The 50-day SMA (blue) at $139.99 provides dynamic support and has guided the recent breakout.
The 200-day SMA (red) at $118.93 confirms a strong long-term uptrend.
3️⃣ Momentum Indicators:
RSI: At 51.50, showing room for upside before entering overbought territory.
MACD: Positive crossover, with the MACD line accelerating above the signal line, supporting the bullish momentum.
What to Watch:
Price action above the breakout level around $140.27 to confirm the move’s strength.
Potential pullbacks to the breakout zone or 50-day SMA for buying opportunities.
Monitor RSI for signs of overbought conditions or bearish divergence.
NVIDIA’s long-term uptrend is supported by strong momentum and key moving averages, but the big reversal candle is a potential red flag for bulls to monitor moving forward!
-MW

NVDA - Update Update for my latest NVDA post and we can end up seeing a decent pullback sooner than expected as we have a developing distribution pattern in play
Not looking for any trades and waiting for more price development.

NVIDIA Corporation (NVDA): Testing Key Levels Amid PullbackNASDAQ:NVDA
🔥 LucanInvestor’s Commands:
🩸 Resistance: $144.72. A breakout reopens $150 and $153, supported by robust momentum.
🩸 Support: $140. A breakdown could expose $136 and $132 as immediate lower targets.
🔥 LucanInvestor’s Strategy:
🩸 Long: Above $144.72, targeting $150 and $153. Wait for confirmation through volume spikes.
🩸 Short: Below $140, aiming for $136 and $132. MACD is signaling cautious consolidation after a sharp pullback.
🩸 NVIDIA remains a long-term leader, boasting a 185% YTD return. Current price action reflects profit-taking, but buyers should watch for signs of renewed strength above resistance. Sellers should remain vigilant if $140 fails to hold.
👑 "Strength lies in patience; opportunities come to those who can read the signs." — LucanInvestor

NVDIA: Is this post-CES correction THE buy opportunity of 2025?NVDIA turned from bullish to marginally neutral on its 1D technical outlook (RSI = 54.243, MACD = 1.190, ADX = 26.850) as despite yesterday's big rise ahead of the CES (Consumer Electronics Show) event, it got sold straight after the opening today. CEO Jensen Huang unveiled the firm's next-generation of gaming chips and pledged the "ChatGPT moment for general robotics is just around the corner".
Fundamentals aside, the technical price action is clear. NVDIA reclaimed the 1D MA50, a key level during both early 2024 and 2023 rallies. Technically we can argue that this is the best opportunity to buy in 2025, despite being so early. The reason is that both in 2024 and 2023, the lowest level to buy was again in early January. In both instances the stock started a rally and never saw lower prices again.
Of course this is to a larget extend due to the long term pattern, which is a Channel Up since the October 2022 bottom. The sequences followed inside this pattern have been identical and so far October 2024 and January 2025 shares the same characteristics: keeping the 1D MA200 intact as the main support and the 1D MA50 contact being a buy signal. The post January rallies scored over a +100% increase, lasting around 95 days. Consequently, if the pattern continues to hold, we can aim for 250.00 by the end of March 2025.
Today's correction may very well be the best buy opportunity for NVDIA for the whole year.
## If you like our free content follow our profile to get more daily ideas. ##
## Comments and likes are greatly appreciated. ##

Nvidia Extremely bearish
Extreme divergence on the weekly, Distribution is taking place at these levels which usually shapes the top.
Expect sever correction down to the original trend around 50$ and possibly 20$
Recession should be around the corner

$NVDA #BullFlag Thru #Resistance Now #ReTesting (150Cs #Soon?!)I noted a bull flag on NASDAQ:TSLA and noticed NASDAQ:NVDA following the same style.
This looks like a strong flagpole through what was previously ATH resistance down trend.
Downtrend has now acted as support twice. Im hoping the 3rd time will be the charm ;)
Looking for NASDAQ:NVDA 150Cs and NASDAQ:TSLA 550Cs on next YUGE green day ie (SPY 2%+)
-Prophecies (Stay Patient)
PS: Apologies if chart isnt as clean as others. I'm trying to incorporate emojis to symbolize what I see as critical points, which set up critical line/levels, which then set up technical pattern. This is the way...

Possible bear case and short entryNASDAQ:NVDA possible bear case projection with the double-top.
If lost, short entry short entry should wait for a rejection by weekly EMA30, blue box.
Give price a chance to bounce-off $129 and weekly EMA30 before getting beared-up.

NVDA Remains Bearish/Neutral Under This ResistanceNASDAQ:NVDA is seemingly rejecting this level once again.

NVIDIA Bullish Continuation ContinuedHi Traders!
On Dec. 5th I wrote an idea where I explained that I was almost interested in taking a long on Nvidia. Over the course of the month, Nvidia retraced into the high 120's creating a failed swing to the upside. However, I also stated that Nvidia was most likely going to fill in that wick at the stop of 150.000 back in November. Now, Nvidia has broken out of the failed swing, and is continuing to the upside filling in that wick.
From here, I would like to see a bit more of a retest filling in the gap to the upside (I am looking at a Daily TF). If this can happen, that area will give me the best position possible to go Long Longterm. However, I did catch a few contracts at 138.000.
Entry Target: 145.000-147.000
Post a comment here if you're bullish on Nvidia 😁

$NVDA LongNVIDIA Corporation (NVDA) shows signs of a potential rebound based on Elliott Wave Theory and key technical indicators. The chart suggests that NVDA has likely completed a corrective Wave 4 and could be entering Wave 5, signaling a continuation of its primary bullish trend. Divergences in the Relative Strength Index (RSI), MACD, and Williams %R indicate that the recent pullback may be temporary.
The RSI shows a bullish divergence, with higher lows on the indicator while the price made lower lows, a common precursor to upward momentum. The MACD has turned upward, with a bullish crossover suggesting increasing buying interest. The Williams %R, which measures overbought and oversold conditions, also shows a divergence, indicating the stock may have been oversold and could be ready to reverse.
NVIDIA’s strong fundamentals, driven by increasing demand for AI infrastructure and GPUs, support this technical setup. Compared to gold and U.S. Treasury bonds, which have stabilized with minimal growth potential, NVIDIA offers significant upside as the chart signals a potential reversal and renewed bullish momentum.

NVIDIA 200 BEFORE 2026 !!! CAFE CITY STUDIO
NVIDIA (NVDA) has been at the forefront of technological innovation, particularly in the realms of AI and graphics processing, positioning it well for significant stock price growth. Here are several reasons why NVIDIA's stock might hit $200 by 2025:
Dominance in AI and Data Center Markets:
NVIDIA's GPUs are the backbone for many AI and machine learning applications. Their leadership in this space, especially with the advent of AI-driven technologies across industries, is expected to keep revenue growth robust. The company's data center segment has seen exponential growth, with analysts predicting a continued upward trend due to the increasing demand for computing power in AI applications.📷📷📷
Strategic Product Roadmap:
NVIDIA's product pipeline, including the Blackwell architecture, is anticipated to propel the company forward. The Blackwell chips, expected to launch in 2025, are designed to push performance boundaries for AI applications, potentially capturing more market share and driving revenue. The expectation around these new architectures creates a bullish outlook for
NVIDIA's stock.📷📷
Strong Financial Performance:
NVIDIA's financial results have consistently outperformed expectations. For instance, Q2 FY 2025 saw a revenue increase of 122% year over year, demonstrating the company's ability to maintain high growth rates. Despite a natural slowdown expected due to tougher year-over-year comparisons, the company's growth is still projected to be impressive at around 43% for FY 2026, supporting a narrative of sustained stock price appreciation.📷📷
High Barriers to Entry and Market Moats:
The complexity and performance of NVIDIA's offerings create high barriers for competitors, ensuring NVIDIA's market leadership. Analysts highlight NVIDIA's 24-month technological lead in AI GPUs, with high switching costs for customers locked into NVIDIA's ecosystem. This moat is expected to support premium pricing and market share retention, which could translate into stock value growth.📷📷
Analyst Optimism:
Numerous Wall Street analysts have set price targets for NVIDIA well above its current levels, with some predicting it could hit $200 or more by 2025. These forecasts are based on NVIDIA's strong fundamentals, technological edge, and market position in AI and computing solutions.📷📷
Market Sentiment and Valuation:
Even though NVIDIA's stock trades at a premium valuation (62 times trailing earnings as of recent data), analysts believe that its growth trajectory justifies this price. If NVIDIA continues to meet or exceed growth expectations, its valuation could expand further, driving the stock price towards $200. However, achieving this target would require either a significant earnings surge or a market sentiment favoring even higher multiples for tech growth stocks.📷
Global AI Adoption:
Posts on X highlight the ongoing global shift towards AI, with NVIDIA at the forefront. The demand for NVIDIA's computing solutions is expected to grow as AI becomes more integral to various sectors, from automotive to cloud computing, thereby supporting stock price growth.

How to Analyze a Stock ? Key Questions to Ask Before You InvestShould I invest in this stock ? This is a common question investors face many times
But where do you begin? What should you look for, and what pitfalls should you avoid?
This guide will walk you through the essential steps to analyze a stock, focusing on the business itself rather than the stock chart. Since earnings per share (EPS) growth drives returns, it’s crucial to understand how revenue growth and margin expansion contribute over time.
Before buying any stock, ask yourself these six critical questions:
1.Company: What does the business do?
2.Economics: How does it generate revenue?
3.Opportunities: What are the potential upsides?
4.Risks: What challenges could it face?
5.Financials: What do the numbers reveal?
6.Valuation: Is the price justified?
1.What’s the Business?
- Mission: A clear mission drives long-term success. For example, Google’s mission, “to organize the world’s information and make it universally accessible and useful,” is simple yet powerful. Does the company’s mission align with a growing trend or an unmet need?
- Leadership: Effective leadership, especially from founder-led teams or CEOs with a strong track record, often outperforms. Assess the team’s vision, execution skills, and employee approval ratings.
- Products: Are the company’s offerings essential, innovative, or part of a growing market? Consider their uniqueness, potential obsolescence, and innovation history.
2.How Do They Make Money?
- Revenue Mix: Is the company’s revenue diversified or reliant on a single product or customer? A diverse mix offers stability, while over-reliance can be risky.
- Unit Economics: Examine profitability metrics like gross margin and operating margin. Where does the bulk of profit come from?
- Key Metrics: Identify metrics like annual recurring revenue (ARR) for subscriptions or gross merchandise value (GMV) for e-commerce that best reflect the company’s performance trends.
3.What Could Go Right?
- Market Growth: Does the company operate in a growing industry, such as AI or renewable energy?
-Innovation: Look for ongoing R&D and a track record of successful product launches.
-Moat Expansion: Assess the company’s competitive advantage, whether it’s a strong brand, proprietary technology, or cost leadership.
4. What Could Go Wrong?
-Market Disruption: Is the company prepared for sudden changes, like new technologies or regulations?
-Competition: Strong rivals can erode market share. Analyze customer reviews and competitor benchmarks.
- Moat Erosion: A shrinking competitive edge—such as declining pricing power or poor retention—can signal trouble.
5.What Do the Numbers Say?
- Profitability: Check revenue growth, gross margins, and net income for consistent improvements.
- Solvency: Assess the balance sheet for debt-to-equity ratios, cash reserves, and financial stability.
- Liquidity: Positive and consistent cash flow indicates sustainability and growth potential.
6.Is the Price Right?
- Valuation Metrics: Use Price to Earnings (P/E), Price to Sales (P/S), or other relevant metrics depending on the company’s growth stage. Compare these to peers and market standards.
-Investment Horizon: Longer investment timelines can justify higher valuations if growth potential exists.
-Focus on Fundamentals: Valuation matters only if the business is strong. Avoid being tempted by low prices without underlying value.
By breaking a company into these six dimensions, you can turn complex decisions into actionable insights. Start with the business fundamentals, evaluate opportunities and risks, and finish by assessing valuation.
What stock will you analyze next? Let’s put this framework into action now

NVDA: Buy ideaOn NVDA we see a spring effect on the support line. Indeed, this indicates that we would have a good chance of seeing the market go up. But, this can only be done if certain conditions are met, namely the break of the vwap indicator and the resistance line with force by a large green candle and followed by a large green volume. But, let's be careful because there can also be a reversal of the trend in the event of a strong break of the support line by a large red candle and followed by a large red volume.

Semiconductor Stocks Blast Off as Foxconn's Revenue Takes FlightA perfect storm of positive factors sent semiconductor stocks soaring, with major players experiencing significant gains. Here are the key drivers behind this surge:
1. Foxconn's Record-Breaking Revenue: A 15% year-over-year revenue increase and a 42% rise in December sales ignited investor optimism in the sector.
2. AI Demand Anticipation: Foxconn's strong results underscored ongoing demand for AI technologies, fueling expectations for future growth in the semiconductor space.
3. Microsoft's $80 Billion AI Investment: The tech giant's commitment to AI-enabled data centers further boosted expectations for increased demand for specialized chips, particularly from Nvidia.
The impact on leading semiconductor companies was substantial:
● Nvidia Corporation NASDAQ:NVDA : Up +3.4%
● Advanced Micro Devices NASDAQ:AMD : Up +3.3%
● Micron Technology NASDAQ:MU : Up +10.5%
As the demand for AI technologies continues to grow, semiconductor companies are well-positioned to capitalize on this trend, driving growth and innovation in the sector.
