PNC - BEARISH SCENARIOPittsburgh’s biggest bank is scheduled to report first-quarter 2022 earnings before the opening bell on Apr 14. While the company’s earnings are expected to have witnessed a year-over-year decline, its revenues are expected to increase.
Short to mid-term we are looking for a breakout and new dip to the next support level situated at $ 163.
Risk Disclosure: Trading Foreign Exchange (Forex) and Contracts of Difference (CFD's) carries a high level of risk. By registering and signing up, any client affirms their understanding of their own personal accountability for all transactions performed within their account and recognizes the risks associated with trading on such markets and on such sites. Furthermore, one understands that the company carries zero influence over transactions, markets, and trading signals, therefore, cannot be held liable nor guarantee any profits or losses.
PNCF trade ideas

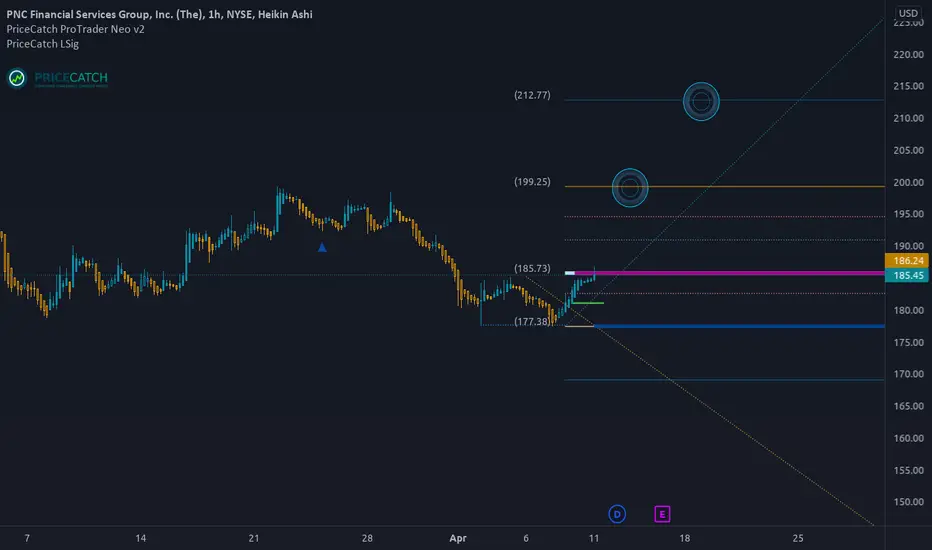
PNC - Long opportunityI was looking at PNC and based on HTF data, I am of opinion price will attempt marked levels. It is at the entry price as determined by ProTrader script. So, let's see how it works out.
$PNC with a Bullish outlook following its earnings #Stocks The PEAD projected a Bullish outlook for $PNC after a positive over reaction following its earnings release placing the stock in drift B with an expected accuracy of 100%.
If you would like to see the Drift for another stock please message us. Also click on the Like Button if this was useful and follow us or join us.

PNC BreakoutAfter a sharp retracement, PNC just brokeout today.
Watching it going into tomorrow session, above todays high.
Room to re-test ATH

PNC pullbackPrice is currently retesting support (previous resistance)
Besides that, this retracement is forming a descending triangle,
Let's wait for a break so we can have a better confirmation.
Nonetheless, great setup if support (buying zone) holds

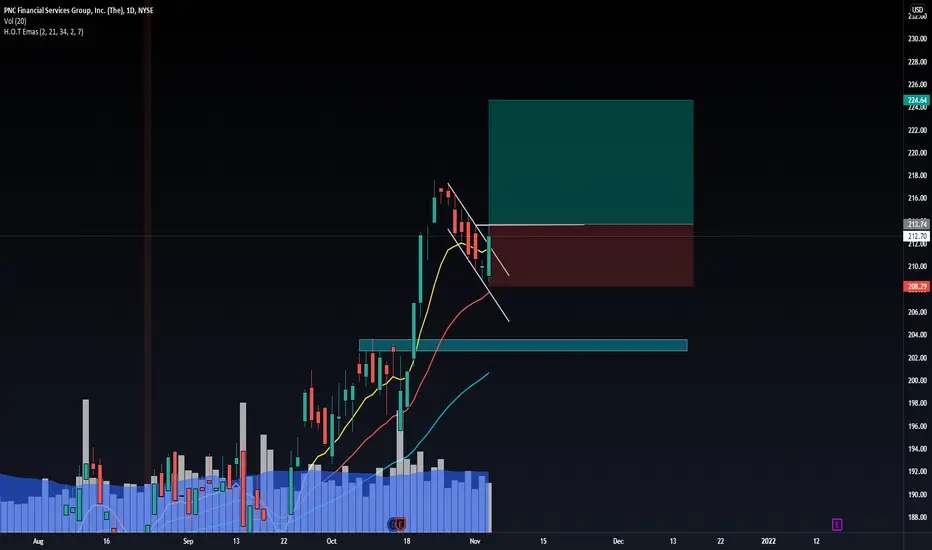
Pnc Trade plan I am bullish on banks currently and pnc has this very nice descending triangle. Around 208-210 it will start its breakout to the upside and hopefully all time highs

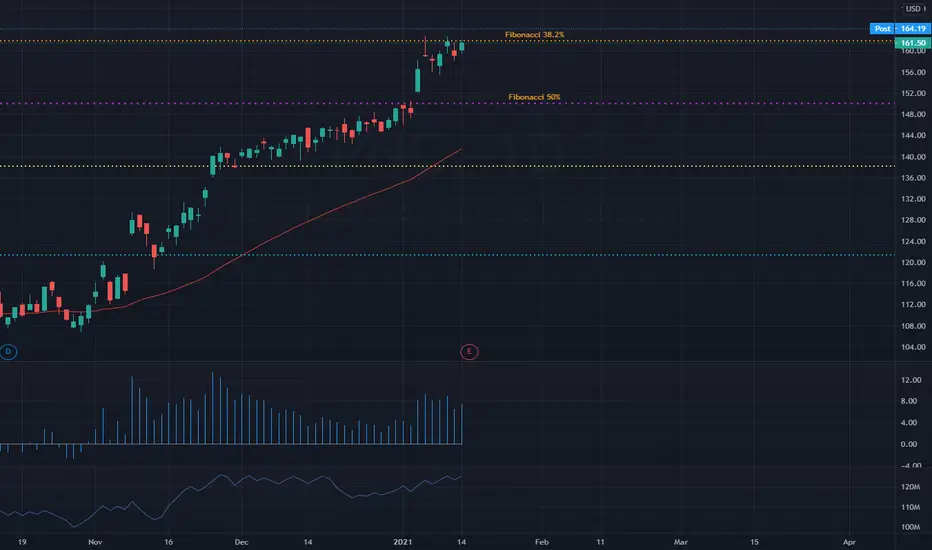
Financial giant $PNC could follow the leader $SIVBWhenever I miss the chance to buy a breakout of a leading stock, I look for other stocks in the same industry. As my personal account is still too small to buy a stock like SIVB , I've been watching PNC to buy when it breakouts from its large base. This strategy has helped me to capitalize industry moves. A good example was when I missed TBK but bougtht CASH . Normally good stocks follow the leading stocks.
The earnings report missed estimates making the stock to gap down but had a higher close, this move could be the handle of the "cup & handle pattern" that has been making since May. I'll wait for the breakout to take a position.
The breakout pivot point is at $205, with a 2:1 risk/reward ratio my stop loss is at $196.55 with a target sell at $224.15. NYSE:PNC has a IBD RS of 84 with a rank #10 in its Industry Group.
Sometimes I like to check the options market of the stock. The option with highest volume and open interest is a CALL option with a 23.61% implied volatility. That means that the market is expecting an upside move of at least +1.50% on Monday, and a +3.40% move in the next 5 days. Next week is key.

PNC flagIf financials can pick up, keep an eye on PNC,
nice flag from massive run,
this has run to retest 217, then 220
What Is An Overextension In The SIMPLEST Terms?A lot of times we get away from simply keeping it simple. When it comes to trading, simplicity will be your best friend. I consider Price Action the "OG" of all technical analysis.
On the same note, I don't knock anyone who uses indicators to make a profit. I do have a few myself that I originally started with, that I still plug in from time to time.
I will ALWAYS keep the Volume indicator on my chart, it's the most important indicator there is to use. Because price may tell you when & where it's happening, but volume will tell you how it's happening. Is there commitment basically.
The other indicators are: VWAP, 21MA, 200MA (I also plug in Camarilla Pivot Points set to "Traditional" using the Pivot with R1-R4/S1-S4 levels only, if price has entered into a voided area).
I use Pivot Points in voided areas to shortcut the calculation & measurement of the potential move & set R1(resistance) for my 1st target on a breakout & I use S1(support) for my 1st target on a breakdown. With the PIVOT(P) level being where price may react either way.
But here with #PNC, I'm highlighting the breakout that happened. The point in this chart is to show an overextension within price itself. The technique is rather simple and quite frankly elementary but effective & that's just to count the bars.
When you begin to see price pushing 3,4,5,6,7,8,9 bars up or down!!! THAT IS NOT A TIME TO GET IN THE TRADE!!...IF YOU ARE IN THE TRADE, REAAALLLLYYY THINK ABOUT TAKING PROFIT SOONER OR SOONER!!
Novice traders sometimes have the misconception that when they see a multitude of green candles pushing up or a multitude of red candles pushing down, that NOW is the time to get in & it's not. You're asking for nothing but small profit, tough managed trades, reversals, anxiety, emotional & financial pain. The people who are already in those trades are the ones making money & taking profit, YOU are the one that needs to sit on your hands, but you choose greed sometimes. Trading is about probabilities, high probabilities and low probabilities. You have a higher probability of price stalling out or reversing on you after 6 or 7 bars up or down vs. A higher probability of the trade pushing ANOTHER 4, 5 or 6 bars up or down.
In closing, just play the higher probability no matter the timeframe.

Looking to test recent highsThe recent gap up has found a new level of support and the consolidation period seems to be ending. Look for a retracement of the consolidation move to test new highs around the end of the month. A failure at the decision box means we're going back down to the 150 level.

$PNV with a neutral outlook following earning releaseThe PEAD projected a neutral outlook for $PNV following a negative under reaction after its earning release placing the stock in Drift D
If you would like to see the Drift for another stock please message us. Also click on the Like Button if this was useful and follow us or join us.

Long | PNCNYSE:PNC
Possible Scenario: LONG
Evidence: Price Action
This is my idea and could be wrong 100%
BUY to PNC FINANCIAL SERVICES GROUP DailyHey traders, PNC FINANCIAL SERVICES GROUP is in a fake downtrend with low traded buy volume and a trace of the high larger than the low. Looking at the TIMEFRAME M1 we can see a hammer bull candle shape, it is ready to breakout a stabilization and price zone. Great chance to join the next higher (See TIMEFRAME M15). And if the buyers are still there, you will brekout the volume to move upwards afterwards.
Please LIKE & FOLLOW, thank you!
BAC-0.22*PNC $PNC (PNC Bank) vs. $BAC (Bank of America Corp)Quantamental Tools for Proprietary and Retail Investors.
Statistical Arbitrage Opportunities Delivered to Your Inbox.
QuantChart. io
Long 100 BAC
Short 22 PNC

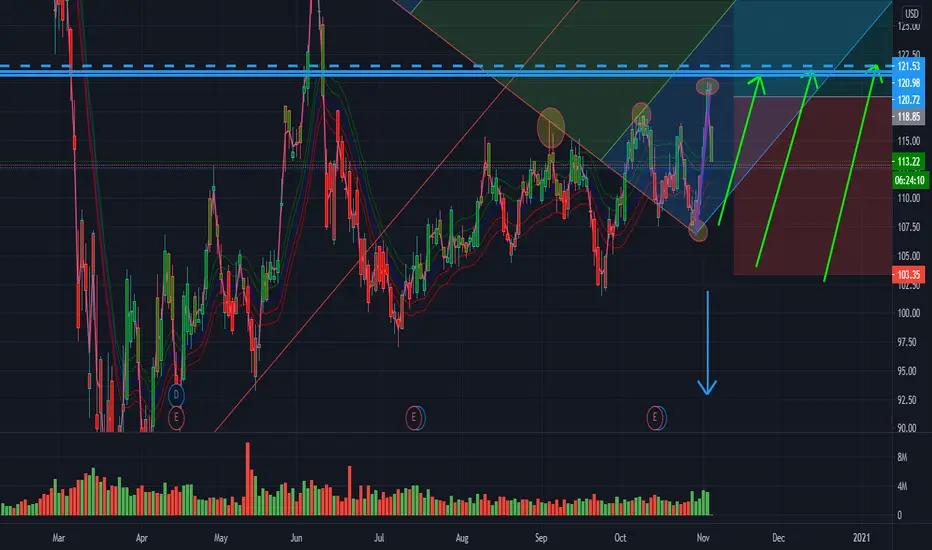
PNC Bullish Ascending TriangleAscending Triangle.
Prepare for breakout at $114.
This may take a week or two but the short term trend is bullish.
Patience is key.
Target: $122

PNC Forming Ascending Triangle$PNC is forming a bullish ascending triangle pattern. A breakout could occur around $114.4. Additionally, the 10-day Exponential moving average continues above the 50-day moving average indicating a bullish trend.
Short term price target is $122 based on previous resistance levels.
Be patient as PNC could also fail to breakout of the triangle.
May be a good stock to watch as Tech continues to suffer


PNC (US) - 60 min sell PNC (US) looks completed its 4th wave triangle after bigger fall with time correction. It also looks like its triangle over & now ready to move down to new low. Sell with stops above 104.20 for target below 80. It is under-performer to SPX index. It's already made a 1st & 2nd wave of 5th wave down. Good sell trade with small stops verses bigger target area.


PNC Linear Regression0.94 Pearsons R value, Linear regression strong uptrend. Various chart patterns identified including, two bump and run tops, a double top, and currently forming an ascending triangle with a possible bullish breakout as a result. PNC is currently trading within a strong upward channel.


PNC Support and Resistance PlayPNC may be rebounding a bit for a pullback to 135
Put spread 140/135 Price was $1.92, Spread 5 points.
Max loss will be twice the profit.
$1.54 will be max profit for a total of $3.46 in the spread.
Max loss is 75% of total price of spread. Which may be taken at 75% of duration of option if the play is wrong so October 14-20. If the play turns out to be wrong and continues higher.
Max loss is $144
