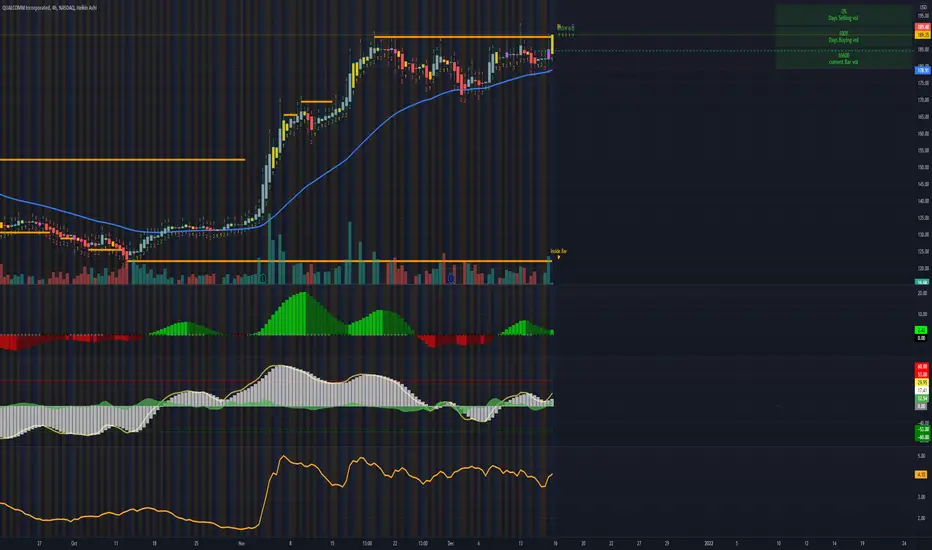
QCOM offering a Pocket Pivot entry in a base on base setup!* Excellent earnings
* Very strong up trend
* High 3-month relative strength of 4.43 in the Tech sector
* Broke out of a 1 year base with tonnes of volume on earnings
* Started to consolidate after the breakout in a tight 7-8 week range
* Has a U/D ratio of 2.11, indicating that it's under accumulation
Trade Idea:
* You can enter on the closing price today as a pocket pivot signal.
* If you're looking for a better entry you can wait for an opportunity near the $183.04 area
* You can look to add to the position if the price makes a daily close above $191.30
Caution:
* This is a pocket pivot signal and though there's little to no overhead resistance, the stock may not break out of the range immediately.
QCOM trade ideas

Is Qualcomm a durable tech stock?Hi everyone,
Today we will talk about NASDAQ:QCOM , a semicunductor manufacturing company.
As we saw almost all tech stocks selling off from late November through to 2022, NASDAQ:QCOM managed to stay up there quite nicely.
The question to ask now: Is it lagging?
Will [ symbol="NASDAQ:QCOM"]NASDAQ:QCOM follow broad tech market and proceed to a major correction?
Or will it continue grinding higher?
Inasmuch as semdiconductor industry is carrying world's supply chain on its shoulders, I still think we could see a correction in the stock.
We've got a looming danger of Fed's interest rate hike somewhere in March-June this year.
I cannot believe any risk asset such as tech stock would stand still when it happens.
Putting macro stuff aside for a moment, we can see a similar pattern in the past of the stock price, where ATHs were reached, touching a rising trend resistence, which led to a rapid 26% correction and 260 days consolidation in the lower range.
I strongly believe that the conditions are ripe for the same scenario to repeat.
I will buy the stock after new consolidation pattern is established, preferrably near 150 level.
Please let me know if you found my macro rant useful and if you would like to see similar content in the future.
Trade wisely and good luck!
-----------------------------------------------------------------------------------------------------------------
Disclaimer!!!
This is not financial advise

qcom sell updateQCOM , after waiting 2 weeks. Qcom finally gave a direction on the weekly.Bounce off the previous resistance.
looking for sell trades this week on this.

$QCOM - Flag pattern formed, watch for breakout either side- RSI divergence
- Weekly outside bar
- Daily flag pattern
- Levels posted in chart

$QCOM to New Highs?$QCOM is close to its ATH around 192 area (from December). Really liking its value relative to other names in the semiconductor space and with the rotation that's going on right now could see it breaking through this level soon. Very bullish options flow...

QCOM Fake-Out BreakOutEarlier this month, I posited the idea that QCOM was trading in a consolidation pattern. The idea was simple, go long on a breakout and short on a break down. The trade triggered to the long side and since then, the stock has retraced. However, I noticed a pattern that I call the "Fake-out-break-out." If there is an actual name for this pattern, please let me know. Simply put, the fake-out-break-out pattern is a double fake out that stop hunts long positions and then traps short positions. The asset breaks to the upside for the long trade, retraces during a stop hunt and fakes the shorts out on the downside only to return higher. I have attached a similar scenario below. If this pattern holds true, the target should be 190+.

QCOM - Qualcomm Inc.Bought position into break of pivot from the previous earnings-gap run. This is the fourth attempt to breakout from this pivot. Stop loss below the low of the day.
Bigger picture, the stock is breaking out from a large base to new all-time highs and remains one of the leaders in the market. It has big growth numbers and is in one of the strongest areas of the market.

$QCOM getting tight and nice$QCOM is back. noting resiliency to #NASDAQ weakness
She is getting tight and nice.

US Stock In Play: $QCOM$QCOM setup on both daily and weekly displays a pretty HTF with 50DMA / 10WMA catching up to its current consolidation.
this is one of the few semicon setup that have not rallied beyond its ATH this week

QCOM to 195-196QCOM has been diligently staying within the shown ascending channel. Due to the reliability in Fibonacci levels, I have a short term price target of 195-196 before any correction.

QCOM COnsolidationQCOM is currently consolidation in a triangle pattern. It has shown the 3 lower peaks pattern which consists of 3 lower highs and 2 lower lows. The pattern eventually breaks down much lower. This pattern can be seen at the top of an uptrend. Conversely, this pattern could set up to break higher. The current trend is up and we are bouncing off of the 20ma. On the short side, I could see a move down to $168. On a break higher, Im looking for $200. My bias is currently bearish but I will stay neutral until the consolidation breaks.

ST I want this to push HigherI would look bullish above $138.75 but would take a short position if we close below $183.90
*DYDD

Qcom Short to fill in the gap the thesis is that the stock is consolidating after a hard sell off in the previous gap and will continue to dip into the next gap. Simple, i also am bias because i think the money has left tech stocks. Please comment opinions down below to save me from my choices lol

QCOM UPDATEQCOM found supply at 188. would look for a retracement level for bearish bias. trade lightly wednesday is FOMC RATE decision.

Bull flag but tech took a major hit any thoughts on this ..i guess it filled the gap so it can take the ride back up


$QCOM approaching ATH.$QCOM approaching all time high and price target recently upgraded to 215. $QCOM setup is clean sitting above the ema lines. today tech stocks bounce after fed meeting and there might be bullish continuation tomorrow.
buy call above $191.30
buy puts below $186-185
always take profits as you see one and always follow your risk management.
Hello everyone,
welcome to this free technical analysis . ( mostly momentum play )
I am going to explain where I think this stock is going to go over the next day or week play and where I would look for trading opportunities.
If you have any questions or suggestions which stock I should analyze, please leave a comment below.
If you enjoyed this analysis, I would definitely appreciate it, if you smash that LIKE button and maybe consider following my channel.
Thank you for stopping by and stay tune for more.
My technical analysis is not to be regarded as investment advice. but for general informational proposes only.
Bull flag without a Flag Pole ?lol a little confused on how to play this myself so i guess just wait on confirmation

Bull flag without a Flag Pole ?Im undecided but there is a gap so i guess wait for confirmation lol but if anyone has any suggestions I'm all ears.

10-20% correction in Qualcomm It seems QCOM is making a top formation and could experience a 10-20% correction in the coming weeks!
I was not Bearish on this one!
You can see the most important support (green lines) and resistance (red lines) to watch in the coming days in these charts!
Best,
Moshkelgosha
DISCLAIMER
I’m not a certified financial planner/advisor, a certified financial analyst, an economist, a CPA, an accountant, or a lawyer. I’m not a finance professional through formal education. The contents on this site are for informational purposes only and do not constitute financial, accounting, or legal advice. I can’t promise that the information shared on my posts is appropriate for you or anyone else. By using this site, you agree to hold me harmless from any ramifications, financial or otherwise, that occur to you as a result of acting on information found on this site.

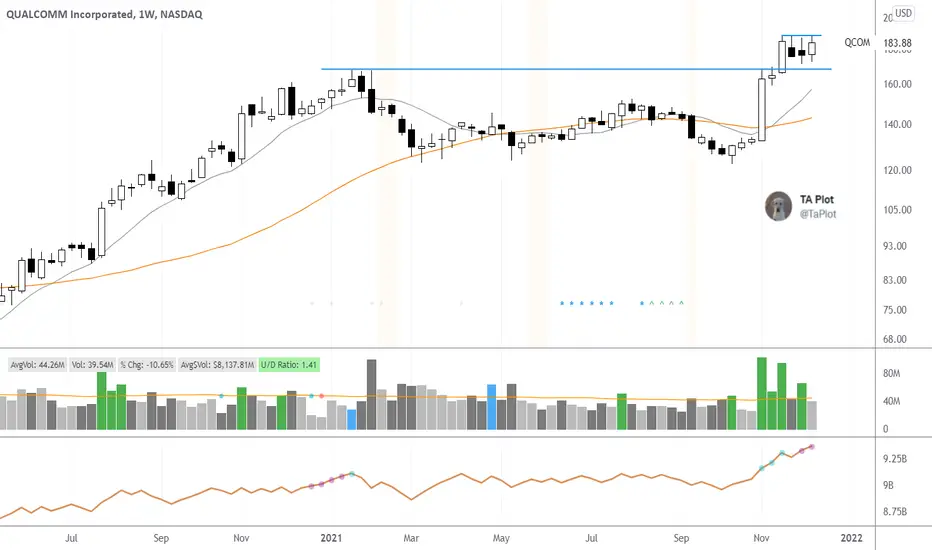
$QCOM Looking Strong$QCOM looking real good. Not my typical VCP since its already out of its base but tight daily trading none the less.
The weekly (2nd chart) is what caught my attention. that these skyscraper volume on that breakout.

QCOM - Inside Day BreakoutQCOM looking to breakout to above the inside day and push higher than the trend line,. Looking to take calls above $185
