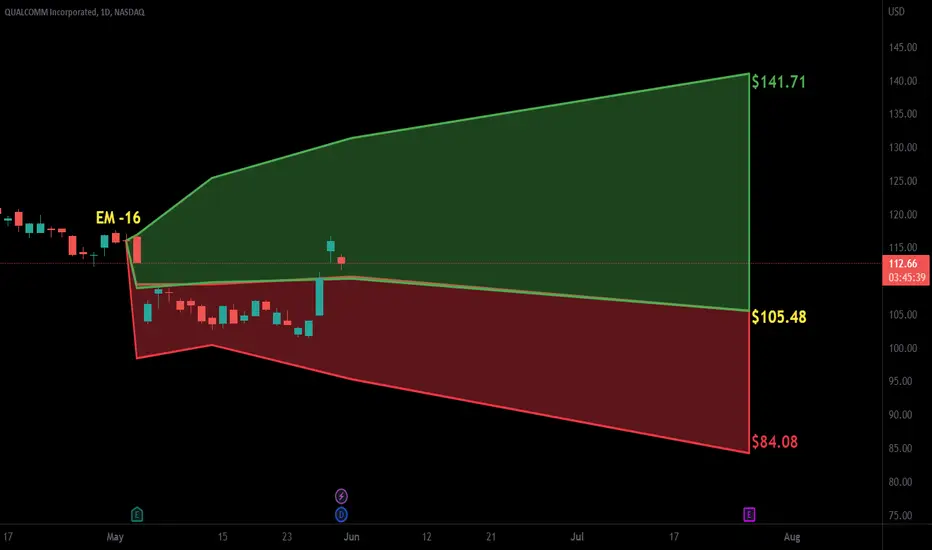
$QCOM with a bearish outlook following its earnings #StocksThe PEAD projected a bearish outlook for NASDAQ:QCOM after a negative under reaction following its earnings release placing the stock in drift D with an expected accuracy of 58.33%.
QCOM trade ideas
QCOM - Rising Trend Channel [MID TERM]🔹QCOM shows weak development in a falling trend channel in the medium long term.
🔹QCOM has broken a resistance level in the short term and given a positive signal for the short-term trading range.
🔹QCOM is approaching's resistance at 120, which may give a negative reaction.
🔹Overall assessed as technically negative for the medium long term.
Chart Pattern;
🔹DT - Double Top | BEARISH | 🔴
🔹DB - Double Bottom | BULLISH | 🟢
🔹HNS - Head & Shoulder | BEARISH | 🔴
🔹REC - Rectangle | 🔵
🔹iHNS - inverse head & Shoulder | BULLISH | 🟢
Verify it first and believe later.
WavePoint ❤️

Is the bullish run on tech stocks done? check out QCOMAfter taking out the October and November lows, QCOM has surged to activate a Fake Break Down reversal pattern, as well as an odd looking island reversal pattern, leaving behind almost the entire month of May's trading days. It might need a breather here as it runs into some short term resistance, but I'm long.... 🤷♂️

QCOM! trend support seems to be holding for the moment, looks like going to fill the gap in the v st... double bottoms etc... start trading w long bias and build on if it breaks above the downtrend resistance

QCOMDue for a break to the upside. Bull flag formed from the past week. Could break up and test upper bounds of trend line towards gap fill.

How to Trade Three Outside Down PatternsHow to trade three outside down patterns with entries and stop levels.

Accumulate for long termPrice is testing at Fib 0.618 just right above the up gap.
Stoch and MACD oversold, a short term trade to fill the down gap with potential 8.19% return is possibe too.
I would nibble some for long term.

Levels to day trade QCOMQualcomm said in September last year that its automotive business "pipeline", or potential future orders, rose by more than $10 billion to $30 billion since its third-quarter results were announced in late July, as automakers increasingly equip their cars with driver-assistance systems.
The company, which has credited the jump to its Snapdragon Digital Chassis product, competes with Intel's Mobileye Global (MBLY.O) and Nvidia Corp (NVDA.O) for that slice of the market.


2000 vs 2020 Tech crashesQCOM was the hottest stock of 1999, and had a similar fall from grace as the biggest tech names of the time, if not faster. Some of the top tech stocks by market cap were: MSFT, CSCO, INTC & IBM
I believe in a 2-3 year bear market, but we are pretty close to 2000 levels in a lot of major Tech stocks already. A lot of people wanna sell it to the floor as fast as possible, but that's not what the bear market really looks like. It's the white box.

M Pattern2 touches to the 1.113 and at a support level today once again.
A Pocket Pivot (smart money footprint) noted at the 1.113. Nice to see a PP but these can fail to provide support as smart money is not always right and another firm/rich guy with bigger feet may sell a butt load of shares the same day or the next. (o:
There is an old gap not far below price (look to the far left) that could fill or provide support.
Strong stock but I am possibly overly cautious/concerned that the 1.113 may fail so I am watching this. Leg 2 terminated at the .786 or close to it which fills the bill for a butterfly pattern that would dip in to the old gap up and should terminate near the 1.272. Peak 2 is lower than peak 1 in the crooked M pattern.
Patterns have been failing as of late so I do not count on anything as of late except take a profit faster than I used to.
I will revisit this.
No recommendation

QUALCOMM Stock Chart Fibonacci Analysis 032923Trading Idea
1) Find a FIBO slingshot
2) Check FIBO 61.80% level
3) Entry Point > 123/61.80%

ABC/DTarget 1 has been met but I just re-evaluated this chart.
The target is D. Possible stop below C.
No recommendation.
ABC patterns are a common measured move and can be bearish or bullish.
Resistance trendline overhead.
Price is above the .618 of the trend up since the Covid low, and it appears the 50% level is causing some resistance

QCOM in a bearish trend channel🥶break of 115 will lead to more blood, break of trend resistance/120 and we may see a rally.
Boost and follow for more. thanks 💛

QCOM // Fibo 0.236 and 106.95 attention.We need to hold on the Fibo 0.236 level. Our second support point is 106.95. Those who want to buy from the resistance should look for a wedge close in the daily time frame. Pay attention to the weekly wedge resistance.

QUALCOMM Stock Chart Fibonacci Analysis 022823Trading Idea
1) Find a FIBO slingshot
2) Check FIBO 61.80% level
3) Entry Point > 123/61.80%

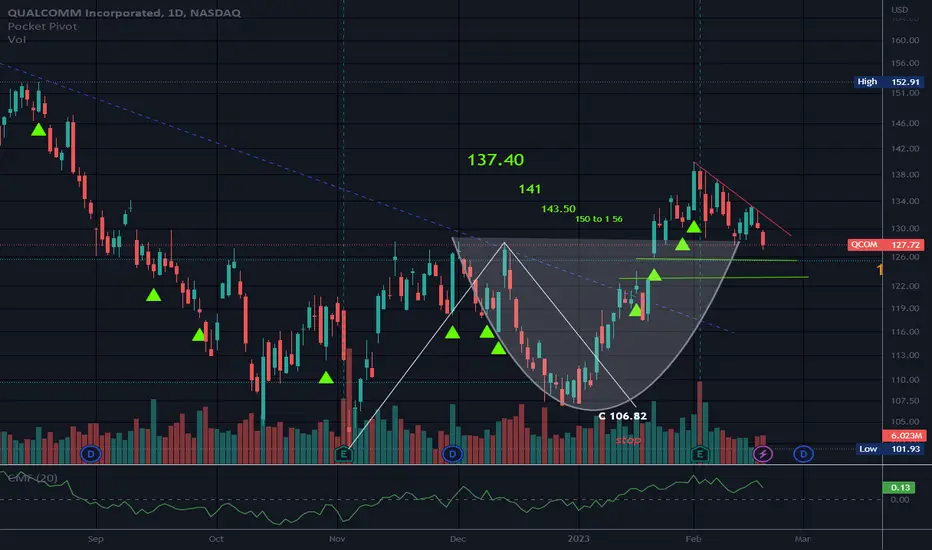
Descending TriangleCup and Handle noted that did not reach full targets.
All triangles are neutral until broken.
This one is a descending triangle as the bottom line is flat and the top line slopes down.
No recommendation/There is a window below price that can serve as support
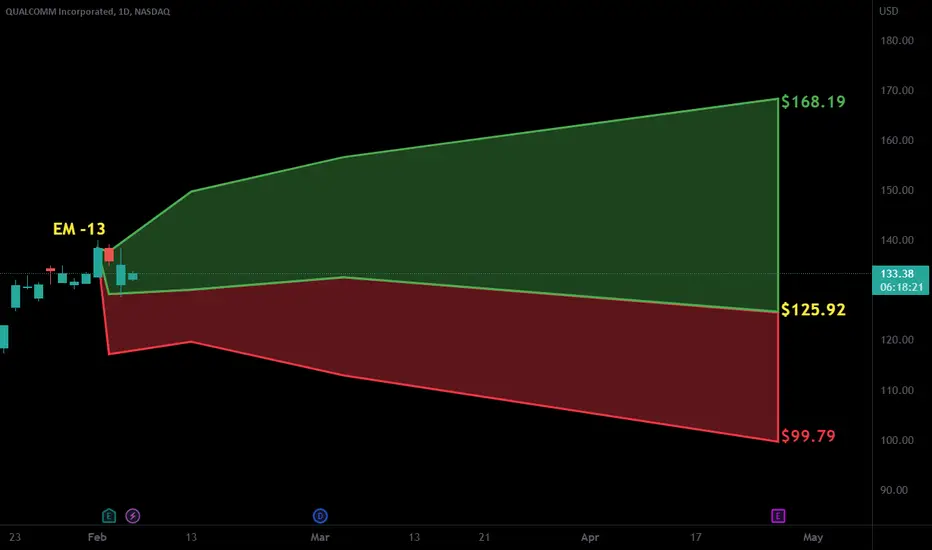
$QCOM with a Bearish outlook following its earnings #Stocks The PEAD projected a Bearish outlook for $QCOM after a Negative Under reaction following its earnings release placing the stock in drift D with an expected accuracy of 54.55%.
QCOM Setup for LongQCOM 1H Setup
1- Down trend broken and now the trend is up
2- currently price is in channel but expected to break and come down
3- next support is: 131
4- Next Resistance is at: 142
5- Entry Zones are
- Zone1: 135 (current price)
- Zone2: 132

Qualcomm stock and best entry pointsI will be intereseted to aquire this stock if it reaches 55-70 level or less.Not before that. What do you think?


Qualcomm Inc (Long)Qualcomm Inc
Long
Entry at 131.03
Take Profit at 142 (8.32% profit from entry)
Stop loss at 125

QCOMThe pressure against money markets has been declined since the actual inf. data is approximating the expected inf. data. Avg cost is 115 usd.
Not an investment reccomendation.
