what a ripbig rip off here with this company ...making money on adverts?? ok 80$ stock Maybe .. sorry for u folks that got sucked in ...who ever told you about this .? Stay away from!!!
ROKU trade ideas

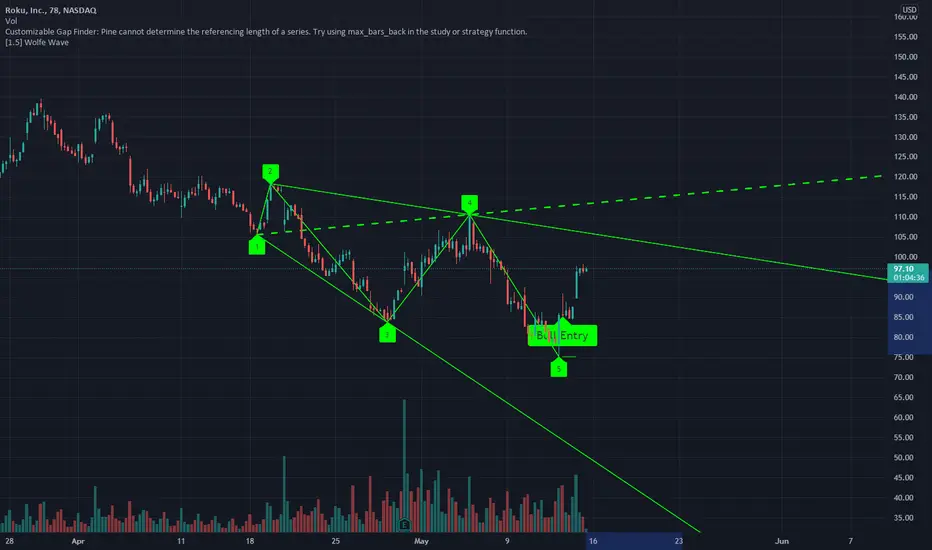
$ROKU 78-Minute Wolfe WaveRoku Wave 5 has developed on the 78-minute time frame and the trigger candle has formed. This wolfe wave setup has currently captured >25% move and has potential to move towards the Premarket Gap at 109.

$ROKU Double Top Trade Idea$ROKU has earnings coming up on the 28th I believe and is in a text book "double top" pattern. I got price targets of $93.45, $87.83 and $81.90.
It's crossed over the neck line @ $99.64 on the daily. A daily candle closed under $99.64 would probably be the safest entry but I'm already in 4/29 $80 P and 4/29 $75 P.
Generally speaking Roku usually follows $NFLX. In regards to earnings I don't expect as an extreme move as Netflix but I am bearish on $ROKU leading up to earnings this week coming up. I'll update my position win or lose when I close out my contracts.
*I'm a self taught trader, this is not trading advice in anyway shape or form.


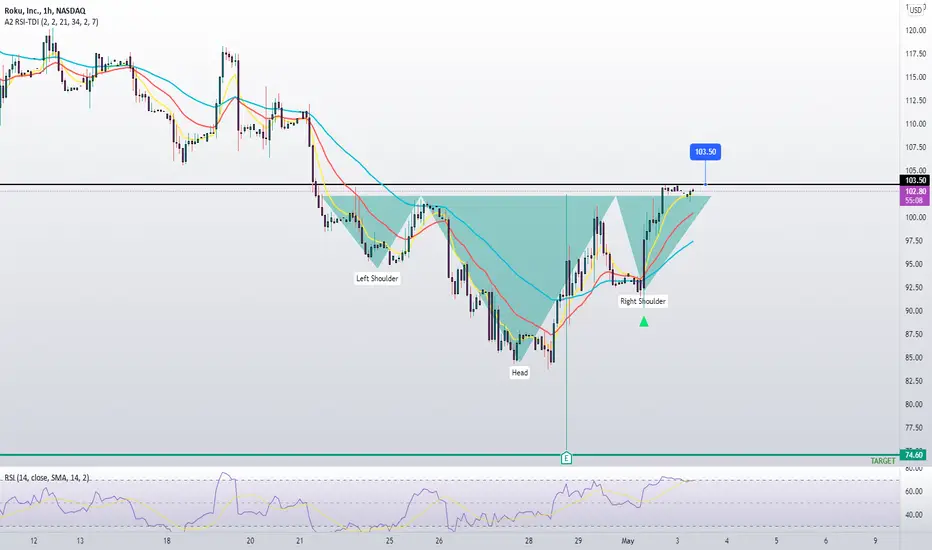
ROKU Inverted H&SClassic inverted H&S on ROKU,
Waiting for a break of the neckline for a confirmation.
FOMC tomorrow, so market might be choppy, be careful!
New Swing : ROKUPossible bullish cross on the go after earnings.
Swing #34
Will go long > 106.16
..... targets 113 / 121 / 136 / 141 / 167
Will short it < 89.45
..... targets 85 / New Lows
following EMA 21 and 50

ROKU buymight be one of the only buys i see in the market these days, lots of value here potentially

lovely break past trend resistance <3roku breaking past local trend resistance with heavy buy volume!
short term price targets are 99.27-106.99-114.71

EARNINGS: ROKUEarnings week for ROKU and I am expecting a downward move after misses of projections.

ROKURoku maybe after ER will finally go down towards that 70 target??
I'd be interested in playing the puts to the downside on this name after what I saw happen to NFLX.
Weekly looks like it wants continued downside.
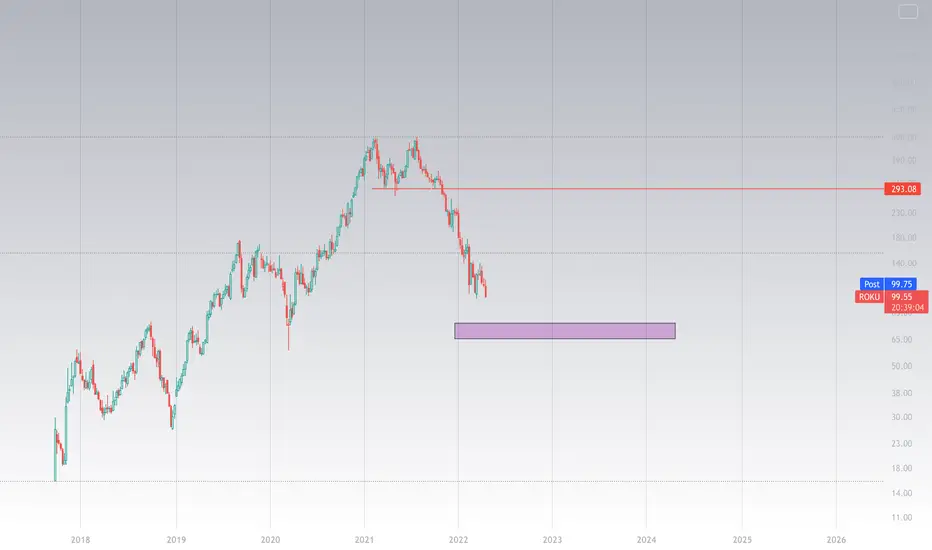
WAS ROKU sell-off predictable??Of course it was! The Double Top is one of the most obvious chart patters you can find:
And i think it might go just where it all started: at the Covid lockdown level of $59.
I know that today ARK bought around 400K shares, but i think they are wrong, ROKU hasn`t bottomed yet!
Looking forward to read your opinion about it.

ROKU small drop then big pop - using harmonics and wolfekraftLook for a drop to around 104 (102-107 range = bounce zone) to start next week, followed by a pre-earnings run to 130s, then earnings pop/continuation to low 160s. After that it will be time to get short for a drop back to 120s-130s (will revisit and adjust for precise levels along the way and send updates).
Logic :
- My model for overall market (in sync with crypto) is for a small decline early next week- SPY 432 - and then upside through April 29-May 11 - SPY 450-455... after this expecting final leg down of bottoming structure (~ SPY 400-415 by late summer/early fall) to complete bottoming structure prior to starting a bullish impulse wave to new highs into 2023. The math for ROKU aligns with this direction and timeline, and so do a lot of other names!!
- Correlation to NFLX has been a thing for ROKU in the past - my model for NFLX expects Bullish Earnings price action (earnings this week)... pop and continuation to 400s by early May followed by drop back to 350ish. This schedule indicates ROKU will bottom (locally) prior to NFLX earnings release and then begin its own pre-earnings run up.
Chart :
- Completed Bullish Navarro 200 harmonic March 15th at the 98 level. The " enter long " for the start of retracement to 272 (pt1, expect by 2023), 500 (pt2, later...), 732 (pt3, like 3-5 years probably) is sustained run above 137
- Post-Navaro ROKU completed a Bearish Shark (semi-major) Harmonic and hit pt1, pt2 is 104
- I am noticing a larger (major) Bearish Harmonic* forming that will complete C near the 104 level, and would complete with a run to D = 161-168 {(*) could be any of the following: Max Gartley (most likely), Max Bat, Leonardo}
- Also noticing a (minor) Bullish Harmonic** forming in conjunction with (*) - (**) would complete D around 104 and have a 1.618 retracement to 161 and is likely a harmonic known as a TOTAL 1
- There was a bearish wolfe wave end of march with 1-4 projection/support still needing to be hit to complete downside move. This aligns with the 104 level early this coming week (4/18-4/20)
- There was a bullish wolfe wave that broke out of channel end of last week and will need to re-test top of channel before running to 1-4 projection/resistance... guess were the top of channel retest level is... hello 104 (again). Note that options are priced for move to 103-121 next week, 104 makes sense in alignment with chart structure.
Prediction: :
- Based on the above info, if ROKU bounces around 104 early next week my max initial target going into earnings is 139 in the right conditions (i.e. NFLX gets big earnings pop, market starts bullish run into May) - 139 would means 1-4 wolfe projection/resistance is hit by around Apr 25-27th , ROKU earnings is Apr 28. If this happens that would trigger enter long (above 137) on the retracement for major Bullish Navarro 200. A more conservative initial target is mid 120s going into earnings, this would save some room to continue to 1-4 projection post-earnings.
- Target by May 10 is 161
- Expectation after target is drop from 161 to test the 137 entry level. This drop would be in sync with expected market bottom. Depending on when Market bottom and where, ROKU could drop further than 137 in accordance with (*).
THIS IS NOT FINANCIAL ADVICE, but if you're curious how I am playing this:
- looking to enter Apr 29 120.00 calls and May 13 130.00 calls IF ROKU bounces from 104ish early next week. Would take profits on the Apr 29s before the earnings release if my prediction materializes, and let the May 13s ride to target.
Bless you all, let me know your thoughts.

ROKU IDEA!I love this setup of $ROKU. It had very tough time but I believe its ready to go green the next couple of weeks. Let’s watch it!

ROKU reverse H&SRoku looking pretty good here. Been massively beaten down and due for a correction. Reverse H&S and indicators are looking pretty good. I think it could fall a tiny bit more before it pops but if you zoom out to pre-COVID (the thin green lines on my chart) you'll see it has reverted to that channel / mean and actually just dipped below it a bit, so barring something insane it should only go up from here. GL

ROKU, short term bearish, long term bullishCurrently in Wave-4 correction, which most possibly will take it to 61.8% of Wave-3 towards weekly pivotal line and then rally up.

ROKU - Falling Wedge Breakout + Bull FlagWeekly Timeframe:
Strong Hidden Bullish Divergence
"Batman" Pattern
Major volume spike at $100 bottom, aligning with previous support areas
Daily Timeframe:
Broke out of a Falling Wedge
Bounced at an RSI-based supply zone
Formed Bull Flag just under supply zone and volume shelf
65m Timeframe:
Bull Flag under supply zone
Rejected Trendline formed from March 15th bottom
Volume and flow suggesting short term bullish sentiment
I expect a bounce for the severely beaten-down stock. Whether it will be a full revival to all-time highs, I cannot say, though I am quite doubtful. Playing the short term bounce. I am leaning bullish, but will stay neutral and watch price action.
With a breakout from the bull flag:
PT1: $136
PT2: $140
PT3: $142
PT4 (Stretch): $148
Failing the trendline would invalidate this setup and could be cause for puts.

Roku Trade Setup! Hello Everyone! From an Elliot wave perspective, This is a super clean chart. The recent 8 month decline in roku was sharp and didnt correct up in any way. It also reached the .786 retracement of the entire move up since IPO. Because of this, I believe we are in a wave B of larger wave 2. I would wait for roku to drop around 110, and go long targeting 190-250. From there, I expect prices to reach 55 where there is major weekly liquidity that needs to be filled.

$ROKU Trading it 3/31below 128
121-124 possible intraday
idea only valid if market red/negative 2morrow
#optionstrading #options #daytrading #tradeideas #stockmarket

Roku 3x a charm !!!!!! See you on top Strickly the best!!!!!!! This a pure example on how charts show you the road

ROKU Similar SituationsUsing the parabolic glitter indicator it can be seen a brief double top period has repeated (in red rectangle), price following this structure should follow also.
Bars pattern placed is just a guess of how price will behave on this daily timeframe

ROKU breaking downtrendROKU could be setting up for a big move. MACD on the weekly chart has turned green, on the daily the ultimate oscillator is showing bullish divergence and we just broke over the downtrend. Looking for a move to $140 in the short term.

ROKU - breakout from Breaking out here from the resistance trendline and looking promising
💰 take profit: 134.7 / 141 / 154
📉 stop loss: 117.7
Starter
- add 129.58 / 130.87
