SAP More chance to up in priceThere is a high probability that the price get to 120.58 dollars ,
Please support this idea with like ,if you find it useful ,
SAP trade ideas


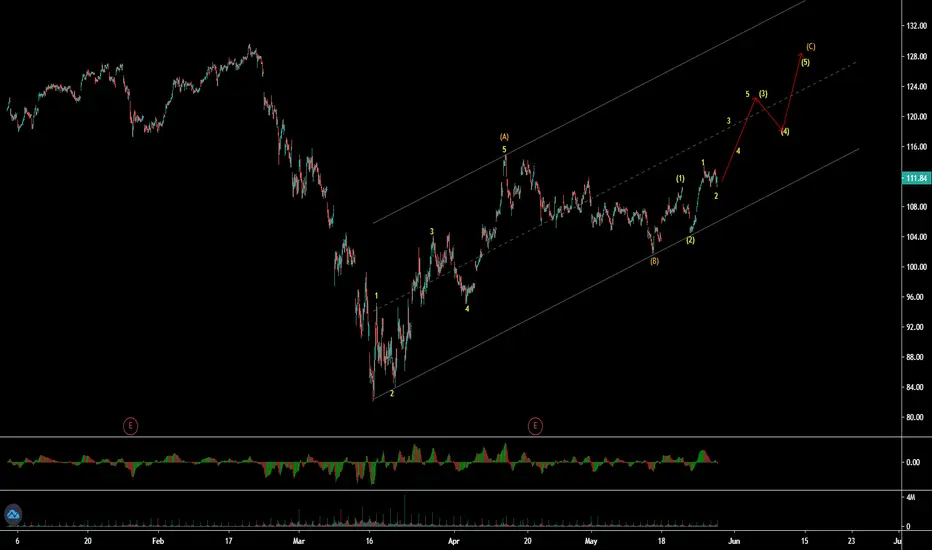
SAP SE (SAP - Xetra) - ABC wave patternSAP SE (SAP - Xetra) is in ABC zigzag up move in 60 min time frame. Currently price is in 3rd wave of C wave up. Overall the stock is in strong up trend and in weekly it may in 5th wave, which means the up move in 60 min will be impulse. Next movement will decide what will gonna be impulse or ABC.
SAP SE OutbreakIf the H4 closes over 114.92 the way is free to 123€ - 126€. And from there it is not far to a new ATH.

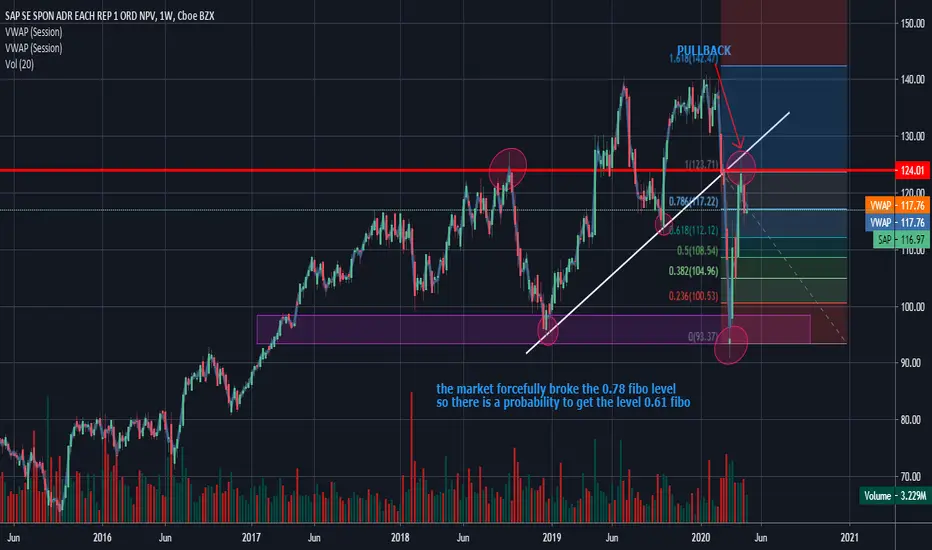
SAPthe market forcefully broke the 0.78 fibo level.
so there is a probability to get the level 0.61 fibo.
f you liked this idea or have your opinion on it, write in the comments.
DISCLAIMER: As a trader you should consider your own risk:reward ratio and do proper lot sizing according to your margin and leverage level. Not every idea is a valid trade. This analysis is a trading idea, not a trading signal for you.


SAP Averted Death CrossSAP has been in a large upward trend. With a double bump and run, an island bottom, and a diamond bottom. Recently the price has been near a death cross however this has been averted with the recent price rise. Volume has recently seen a steady decline. Expect this bullish trend to continue.


Long term buyTrend analysis:
monthly - up
weekly - up
daily - up
hourly - up
can buy until it reaches a sell zone; most likely it will break through this sell zone and then it can be a long term buy

Long term playXETR:SAP
SAP SE pretty much came back down from the hype of Elliott's investement. SAP said growth and operating margin gain were going to improve alot in 2020. Although I think it might dip lower to test shareholders and stop haunt, I feel safe going long, I will average down if it dips.


Great setup for continuation...At least a couple of candles to go after this breakout, don't you think?


$SAP SAP HEADING IS INTO CORRECTION SAP has suffered 3 downgrades recently and unfortunately this can only lead to price declines. From a charts perspective it looks like the B wave has just been completed of the correction phase, giving a target of $87 for the final 3 wave.


Short Drop - Bounce BackBearish in short run -to bonce back to around 113 - 114.
Period from: Feb 5 - Sept 20th
Why: When looking at the six month chart it waffles before trending upward or downward. The waffles have become larger. By placing indicators at the end of large buys and sells, this gives you a range of how far the next break out is going to go.

SAPWeekly reversal Candle just before breakout/ Ranged just below all time high for quiet some time / Strong consolidation with higher lows /

Biggest DAX support is about to fallJugdment of their scandal and change of their tech. but this is necessary to provide new tech. in the incoming "new age"

SAP breakout ath blockchain related tooIts supposed to be one of the stocks in the proposed blockchain etf

