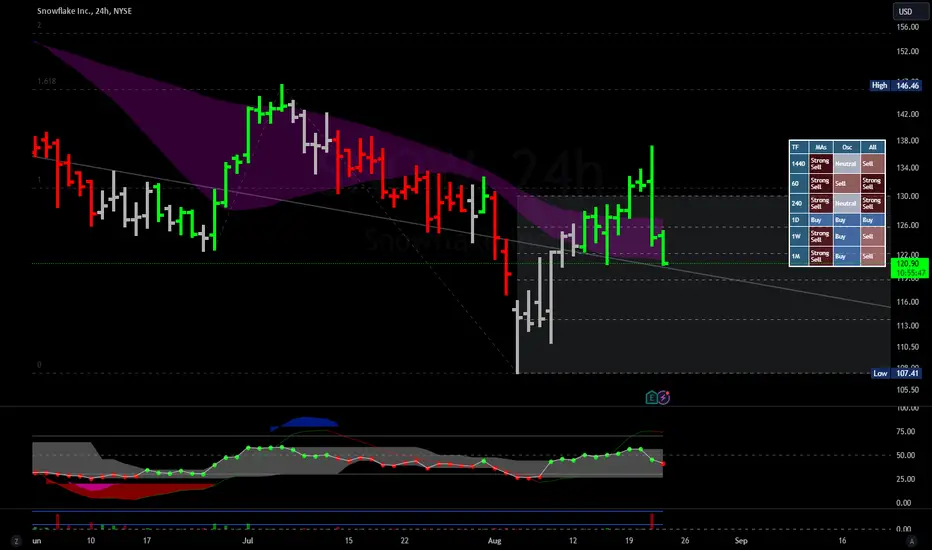
Snowflake (SNOW): Potential Bullish Flip on the Horizon?In our last analysis on Snowflake, we were focused around the MOAT level, which was lost after the analysis. However, we respected the HVN edge low quite well, and since then, we haven't seen any significant new lows.
If Snowflake can hold its current level and avoid retesting lower zones, we could potentially see a flip in the market structure toward a bullish trend. If this scenario plays out, we’ll be actively looking for long setups for SNOW.
We'll keep you informed on whether this bullish scenario materializes or if lower prices prevail.
SNWF trade ideas

$SNOW potential support lineNYSE:SNOW
There is a big change 120/125 will hold as support for a potential reversal.
I'm long with 125 average and will add more if support holds
This is a long term investment or a swing for 6 months at least.
Will update.

$SNOW - Will you buy it here?NYSE:SNOW Snowflake hit the first target before earnings 🎯. It’s now back in the buy area post-ER and seems to be checking back on the trendline. Earnings can always be a risk factor, and they can make or break a setup.
The $122–$120 support has now turned into resistance. It’s not out of the woods yet, but this might be a good area to start accumulating. RSI isn't oversold yet, so I'm not going all in.
As always, I share my opinions and trades. I’m not suggesting anyone follow my trades. You do you.

levels to manage $SNOW after its earning report06:40 AM EDT, 08/22/2024 (MT Newswires) -- Snowflake (SNOW) shares dropped early Thursday as the company issued a downbeat fiscal third-quarter product revenue outlook despite raising its full-year view for the key metric and beating Wall Street estimates for the second quarter.
Product revenue, which comprises the majority of the company's overall revenue, is anticipated to be in a range of $850 million to $855 million for the fiscal third quarter, the cloud-based data platform company said late Wednesday. The consensus on Visible Alpha is for $855.4 million. The stock fell 9.4% in recent premarket activity.
"We forecast product revenue based on observed behavior," Chief Financial Officer Michael Scarpelli said during an earnings call, according to a Capital IQ transcript. "Our forecast does include revenue headwinds associated with performance improvements."
The company reported adjusted earnings of $0.18 per share for the three-month period ended July 31, down from $0.22 the year before, but ahead of the Capital IQ-polled consensus of $0.16. Overall revenue climbed 29% year over year to $868.8 million, beating the Street's view for $850.7 million. Product revenue advanced 30% to $829.3 million.
Financial services and technology verticals drove growth in the second quarter, while the company continued to see signs of a stable optimization environment, Scarpelli told analysts. The net revenue retention rate was 127%, while remaining performance obligations, or RPO, jumped 48% year over year to $5.2 billion, according to the firm.
For fiscal 2025, Snowflake now expects product revenue to come in at about $3.36 billion, in line with the consensus estimate on Visible Alpha, up from its prior outlook of $3.3 billion. The company reiterated its adjusted product gross profit margin forecast of 75%.
"(Snowflake) delivered solid results and an increase to guidance, though we believe investors were looking for stronger incremental product revenue after their strong first quarter," Truist Securities said in an emailed client note. The brokerage still views Snowflake as one of the key beneficiaries of the "rush" to artificial intelligence and maintained its buy rating on the firm's stock.
Snowflake’s Stock Dips Despite Great Q2 Results: What's WrongSnowflake Inc. (NYSE: NYSE:SNOW ), the cloud data-warehouse software company that has been a favorite among investors, recently reported its Q2 earnings for fiscal year 2025, surprising analysts with better-than-expected results. Despite this, the stock took a significant hit, dropping 8% in extended trading on Wednesday. But what led to this sharp decline, and what does it mean for the future of Snowflake?
A Strong Quarter Overshadowed by Growing Pains
Snowflake (NYSE: NYSE:SNOW ) reported Q2 revenue of $868.8 million, up from $674.0 million a year earlier, easily surpassing Wall Street’s estimates of $851.6 million. Adjusted earnings per share (EPS) came in at $0.19, also beating the consensus of $0.16. The company’s product revenue, a critical metric, was $829.3 million, just above expectations. Yet, despite these strong figures, the market reaction was overwhelmingly negative.
So, what went wrong? The company’s net loss widened, and rising costs became a focal point for investors. The broader concern is that Snowflake’s growth might be losing momentum, as reflected by a less-than-stellar product revenue beat. The company’s guidance for the rest of the fiscal year was positive, with a slight increase in its full-year outlook. However, this was not enough to assuage fears about its ability to maintain high growth rates amidst increasing competition and operational challenges.
The Falling Wedge Breakout: A Technical Perspective
From a technical analysis standpoint, Snowflake’s stock recently broke out of a falling wedge pattern, a bullish signal that typically indicates a potential upward price movement. However, the 8% drop in extended trading suggests that this breakout might be tested in the coming days.
Investors should keep an eye on key support levels. The stock may find buying interest around $123, corresponding to its June swing low. If this level fails to hold, a further decline to $108 or even $95 could be on the horizon, where the stock might attract more buyers.
Snowflake (NYSE: NYSE:SNOW ) stock is down 13% in Thursday's premarket trading this move is really bad for Snowflake (NYSE: NYSE:SNOW ) stock as the stock will start the day with a weak momentum from its Relative Strength Index (RSI) of 60.71 which was Wednesday's RSI close. with the stock down by 13% in premarket trading, it will place the RSI at 52 which is bad as it will approach the oversold region leading to more sellout despite earnings beat.
CEO Transition and Security Concerns Add to Investor Jitters
Adding to the uncertainty is Snowflake’s recent leadership change. The company appointed a new CEO in February, which can often lead to strategic shifts that make investors nervous. Moreover, a cyberattack in May that compromised data from high-profile clients like AT&T and Live Nation has not helped restore confidence.
Why Analysts Are Still Bullish on Snowflake (NYSE: NYSE:SNOW )
Despite the post-earnings slide, some analysts remain optimistic about Snowflake’s future. JMP Securities, while lowering its price target from $235 to $190, maintained a Market Outperform rating. The analysts highlighted Snowflake’s strong core business, particularly in financial services and tech sectors, and its potential for profitable growth with a projected $3.36 billion in product revenue for fiscal 2025.
Snowflake’s long-term prospects look promising, especially as the company continues to innovate and roll out new AI products. The market for cloud data services is expected to grow substantially, and Snowflake is well-positioned to capitalize on this trend.
What’s Next for Snowflake?
The next few weeks will be critical for Snowflake (NYSE: NYSE:SNOW ) as it navigates the post-earnings fallout. Investors will be watching closely to see if the stock can hold key support levels or if it will continue to slide. On the operational front, the company needs to address concerns about rising costs and demonstrate that it can sustain high growth rates in a competitive market.
In summary, while Snowflake’s Q2 results were strong, the market’s reaction highlights underlying concerns about its future growth trajectory. For now, cautious optimism seems to be the best approach, as the company works to regain investor confidence and prove that it can continue to lead in the cloud data space.

Snowflake: One last climbSnowflake should rally once more before ending the turquoise wave b. After this corrective rise, we expect a fall to below the support at $107.41, which will complete the green wave (2). Meanwhile, we consider an earlier start to this final sell-off to be 33% likely.

$SNOW - breaking outNYSE:SNOW is breaking out from a descending wedge, and the oscillators are turning up. Snowflake's earnings report is next Wednesday after the market closes. The market sentiment is bearish on the stock, so the question is, can they deliver on these low expectations?
This one is risky, especially with a new CEO at the helm!
Here are the targets:
- $133 (decent resistance)
- $142
- $157 (with $150 possibly posing good resistance)
Support:
- $122
Let's hope next week's earnings don't disappoint.
As always, I share what I think and what I do. I'm not suggesting anyone follow my trades. You do you.🍻

SNOW Snowflake Options Ahead of EarningsIf you haven`t sold SNOW before the previous earnings:
Now analyzing the options chain and the chart patterns of SNOW Snowflake prior to the earnings report this week,
I would consider purchasing the 110usd strike price Puts with
an expiration date of 2024-9-20,
for a premium of approximately $2.70.
If these options prove to be profitable prior to the earnings release, I would sell at least half of them.

SNOW Short IdeaI consider SNOW to be in a range from 144-112. It has been a bearish ticker for a while now and is still near the 2022 lows around 112. It has seen a nice bounce since hitting that area, but it's still bearish. We have an ascending wedge now and if it breaks to the downside I'd expect it to go back for another test of 112. It would be ideal if you could get an entry on the retest of 133, which would also be near the top of the wedge.

Swing trade! Long opportunity! Snowflake (SNOW)I can see a Long swing trade opportunity in SNOW.
Stock is in downtrend, but recently it shows a fading wedge pattern towards the long term support with reduced volume showing loosing interest of sellers.
And recently breaking out of the wedge hinting a reversal pattern and provides us with a Long opportunity.
CMP : 128
SL: 120
T1: 143
T2: 168

SNOW heading below 70?I'm a huge fan of Snowflake, but with how far it is retracing, I'm now just waiting for it to drop below 110 to invalidate the bullish counts. From there just waiting to see this Wave C play out. Yellow is my bullish alt count that was primary.

Snowflake is Melting...If we zoom out onto the weekly chart here, you can see NYSE:SNOW is taking a clear beating, dropping 7.16% to $119.77. The stock has broke through key support levels, and the bearish trend is clear with descending channels signaling more downside. With increased selling pressure and volume spiking, it's not looking good, imo. If the support around $115 doesn't hold, we could see even more declines (especially with VIX over 20!). It's probably time to be cautious and watch for any signs of a bottoming action before considering any moves.

SNOW Bull FlagSNOW has a nice looking bull flag here, but MSFT is still down after after hours. MSFT did have a bounce after the initial big drop when earnings were first released, but it's still putting a lot of pressure on SNOW for now. So it seems kind of hard for SNOW to break out while that's happening, but we'll see where things are when the bell rings tomorrow morning.
SNOW has been very weak and it may gap down tomorrow off of MSFT earnings and if that's the case, I'd be looking for rallies to short. Best short opportunities would be if it gapped down and retested $129 or $133. For upside targets, I'd be looking to take profit on calls at the trendline above if it goes that way.

SNOW - Trading at very attractive levels pre-earningsI would be upset at myself if I didn't point this opportunity out to all of you.
Happy Trading :)


$SNOW - a potential cup and handleNYSE:SNOW Snowflake hit the $147 target mentioned in the June 27 post and has been consolidating. Currently, it has the potential to form a cup and handle base. If confirmed, the stock could run to the $154 - $160 area. 👀🚀

SNOWLong SNOW, expecting a similar impulse up as shown on the chart (at least). Price is again -70% off the post-IPO high, looks like a bargain. In my longer-term portfolio.

LULU & SNOW Short Recap - Finding Shorts in a Bull MarketI wanted to do a review of these trades to explain more about my thoughts and approach to trading. I am typically heavily focused on trend following and Dow Theory, but lately I have been fighting the trend, and of course that hasn't worked out well. However, I've adapted which is what this game is all about.
I don't want to long these strong mega caps up here and I wouldn't short them either. So I've been looking for other markets and tickers to trade which has been going well. Hope it helps.

SNOW -Short term bearish, long term bullishI was very bullish on SNOW until I realized a few things.
1. Decreasing volume on daily
2. Weak RSI
3. Strong resistance at triangle around $145, both daily and weekly closing below it.
Expectation...
Currently basing $140-$144.
Breakout to the upside WITH VOLUME and I'm looking for $158.
Breakdown of $140 I'm not touching until $125 backtest.

SNOWSNOW.
Will SNOW get bids from buyers ?
As the price is at strong support level and bullish divergence indicating the buyers may attack this zone. If this happens and buyers start buying from here then the next target could be 160 followed by 165
What you guys think of this idea?

Correction to 100D SMA for $SNOW Snow looks to have double bottomed after a very strong selloff after earnings. This would be a good place to correct to its key moving averages.
Jul 12 $128C

#snow 134 Above horizontal resistance breakout
21 ema above close
if sustain 140/146/155 can test soon

SNOW - A potential setup for a swing tradeRemain vigilant for daily reversal candles occurring near the support area. In the event of a daily closing breach of the support levels (red lines), there is a possibility of further downward movement, emphasizing the importance of implementing risk management strategies.
