SNOW LongThis name is at an interesting point right now, consolidating right at the golden retracement zone from the recent high. I can get bullish here if macro outlook brightens, but tight stop loss should be enforced. At least worth putting in your watchlist to see if a buying thesis can materialize.
PS- Not Financial advice. Do your own due diligence.
SNWF trade ideas

Is Snowflake Melting Down?Snowflake fell sharply in early 2022. It drifted sideways for more than a year, and now traders may think the software stock is ready for another leg lower.
The first pattern on today’s chart is the double-top in June and July. SNOW has declined since, confirming the bearish formation.
Next, a series of lower highs following the double top has produced a falling trendline.
Third is the rising trendline starting in January. Prices have repeatedly pushed against this support since August, and now it may be breaking.
Finally, the 50-day simple moving average (SMA) rose above the 200-day SMA in early June. However, it failed to stay there and had a bearish “death cross” on October 9. Does that indicate a longer-term downtrend is resuming?
TradeStation has, for decades, advanced the trading industry, providing access to stocks, options, futures and cryptocurrencies. See our Overview for more.
Important Information
TradeStation Securities, Inc., TradeStation Crypto, Inc., and TradeStation Technologies, Inc. are each wholly owned subsidiaries of TradeStation Group, Inc., all operating, and providing products and services, under the TradeStation brand and trademark. TradeStation Crypto, Inc. offers to self-directed investors and traders cryptocurrency brokerage services. It is neither licensed with the SEC or the CFTC nor is it a Member of NFA. When applying for, or purchasing, accounts, subscriptions, products, and services, it is important that you know which company you will be dealing with. Please click here for further important information explaining what this means.
This content is for informational and educational purposes only. This is not a recommendation regarding any investment or investment strategy. Any opinions expressed herein are those of the author and do not represent the views or opinions of TradeStation or any of its affiliates.
Investing involves risks. Past performance, whether actual or indicated by historical tests of strategies, is no guarantee of future performance or success. There is a possibility that you may sustain a loss equal to or greater than your entire investment regardless of which asset class you trade (equities, options, futures, or digital assets); therefore, you should not invest or risk money that you cannot afford to lose. Before trading any asset class, first read the relevant risk disclosure statements on the Important Documents page, found here: www.tradestation.com .

$SNOW forming 200EMA base on dailyNYSE:SNOW forming 200EMA base on daily. Need time to let it settle down before seeing direction.

SNOW - 1hr TADaily = Red
1hr = Yellow
using a variation of FVG & Trends. I wonder if price will test these zones

SNOW looks bearishhi traders
let's have a look at SNOW
SNOW looks weak.
The price is still above the upsloping support but once it breaks down, it may be a good idea to enter the short position.
RSI confirms bearish bias.
Target is shown on the chart.
If the price continues bouncing from the orange trendline, the short idea won't be valid.
Good luck

$SNOW: Hailing at 160 Concerned about the action on SNOW here along with multiple other growth tech names. As it stands right now, I have doubts as to whether bulls will be able to weather a potential storm. Rate hikes may still be quite a distance off considering oil prices which may continue to put pressure on growth stocks in general. ARKK can be followed as a proxy.

SNOW: Sell ideaSell idea on SNOW as you see on the chart after the breakout with force the support line by a big red candle with a large red volume.Thanks.

SNOW: Buy ideaOn SNOW as you see on the chart we will have a big probability to have an uptrend after the breakout with force the resistance line by a big green candle with a large green volume.

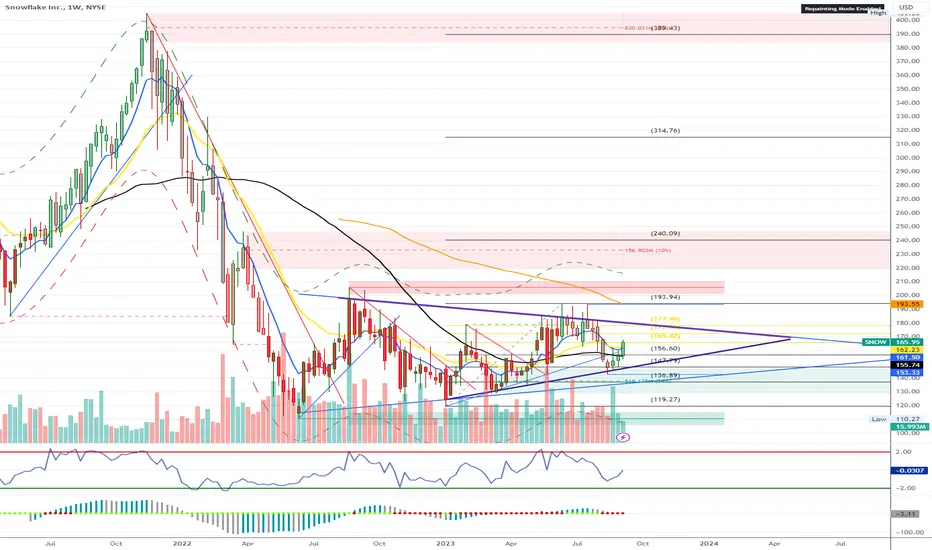
SNOW (Breakout not yet active)SNOW here consolidating in a pennant for over a year
Breakout trigger is over 194. Set alert for 194, if we get a couple of closes above that there is a breakout here to 205 then 240.
This works both ways, as technically the trend going into the pennant was a downtrend, so by definition it is technically a bear pennant. However the breakout or breakdown depends on where the exit from the pennant happens, which for upside is 194, for downside is 135. If below 135 there can be a fire down into 100-110 area.
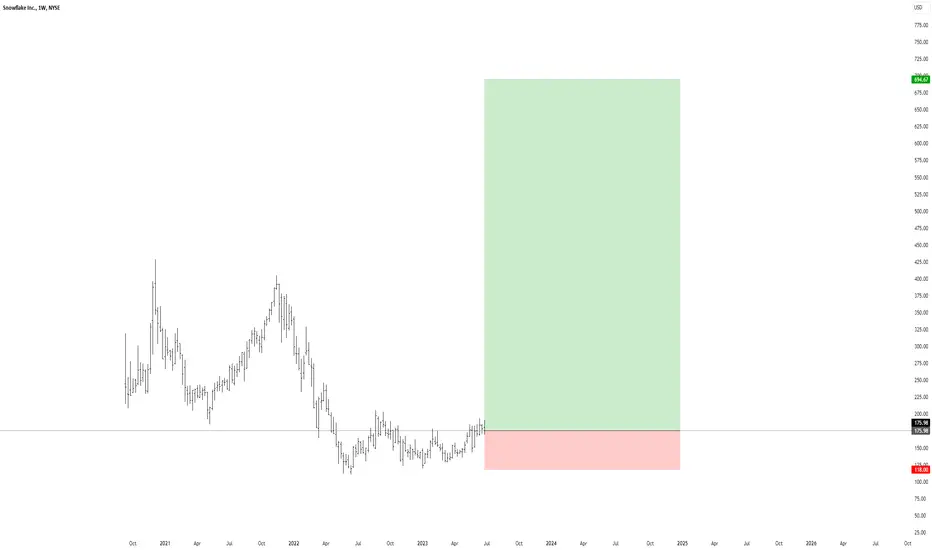
Looking for SNOW to move 20%Snowflake Inc. (SNOW) having come off significant channel support, is now approaching meaningful resistance, able to absorb weekly selling pressures.
From here (SNOW) can fall back to channel support, eliciting losses of 20% over the following 1 - 2 months.
A weekly settlement above resistance would lead to a buy signal in (SNOW) where gains of 20% would be expected over the following 2 - 3 months.

Snow Idea Assuming that earnings report is better than expected I reckon the price could retest the highs on $180 which is where there is alot of resistance at the moment.
NYSE:SNOW seems to be working along that Daily trend line, bouncing every time it's hit.
Stop loss just below the Trend line, gives us enough room for a potential wick down.
Trade:
Long
Entry - $156.45
TP - $175 / $185
SL - $145

Snowflake - Is It Time To Stop Gambling On Chop?Snowflake, a Nasdaq company, has earnings looming post-market, which has IV on weekly calls and puts juiced to 150%.
Yet people are still gambooling on the next big instawin. The problem is you'll blow your account and won't need TradingView anymore and won't be able to have any fun in your community.
Really, a far better proposition if you want 5 and 8:1 odds on things that are like 10 or 20:1 against to hit is to deposit on a sportsbook and put the same risk into a 3-bet parlay on late season MLB.
If you're right you'll even get paid the same day and not have to mess around with charts and bars all day.
Snowflake is one of the tech sector dump casualties, but has never bounced.
The monthly shows very clearly we're simply sitting in $90 worth of range spanning almost a year and a half.
And while $90 in range is pretty good, the problem is that it doesn't pump. There will eventually be a change in market structure and the most likely target is under $110.
Weekly bars show us that the May low has been taken out before earnings, and this is a factor that is not consistent with bank/fund sponsorship to take out the highs.
Which hints to us that the largest players who can move the market of a company that is still valued at $49 billion while printing $650~ million in quarterly revenue are probably targeting the bottom of "the flag" and not the top.
While the failure swing at $190 forms a double top and becomes a target, the problem is that everything is set up, with Jackson Hole as the Federal Reserve and the world's most critical financial policy decision pending on Friday, to continue to correct and correct violently into the fourth quarter.
Nasdaq Futures - The Trend Is Your Friend, Until The End
Moreover, a lot of the worldwide economic situation is being heavily driven by what's going on Mainland China with Xi Jinping and the Chinese Communist Party he still hasn't thrown away.
Word in the Western media is that the regime's de facto state run corporations, for whatever reason, are sitting on something like $3 or $4 trillion in real estate debt that's about to explode in their hands.
There's still the problem of natural disasters like the Beijing floods, economic calamities like the International Rules Based Order jawing and chattering about "de-risking" from China, and the impact of the virus that has claimed many, many more people than the few hundred thousand the CCP has officially reported to John Hopkins for the official trackers.
Worst of all is the 24-year persecution and organ harvesting genocide against Falun Dafa's 100 million spiritual practitioners looms over the head of the Party. Even though Xi isn't responsible for the persecution and hasn't participated, it was done by former Chairman Jiang Zemin and the toad faction nested in Shanghai-Babylon, Xi is the one with his head in the prisoners' box because he's now the Chairman of the Party.
And on top of that is an epidemic of arsons masquerading as climate change that have burned to death tens of thousands of hectares of trees and forests and their associated plants and animals.
This world is out of control, but it's not allowed to stay out of control for long.
And while it's on the brink, you're being told to get long by furus, Discord, Telegram, Wechat, Stocktwits, and Reddit, and are happy to take the bait, because you don't see the danger.
So here's what's up for SNOW on earnings.
A really likely theory is that it doesn't do much at all because the option sellers will just hold the price where it is in advance of Jackson Hole, let IV decline, collect all the premium from you as everything expires worthless on Friday and laugh.
And somewhere along the way, Snowflake will have a $12 retrace to bring in breakup traders and take out short sellers to $165. But this $165 will be another form of optimal short entry to target the $100 mark before Q4 expires.
If there's to be upside on this stock, based on the length of time and range of the chop and the specific price action amid the overall market and macro conditions, it would be a lot more likely to come after the lows get taken.
Be careful.

SNOW Snowflake Options Ahead of EarningsIf you haven`t sold SNOW on this Head and Shoulders Bearish Chart pattern, on Disappointing Growth Forecast:
or reentered here, ahead of earnings:
Then analyzing the options chain and the chart patterns of SNOW Snowflake prior to the earnings report this week,
I would consider purchasing the 145usd strike price Puts with
an expiration date of 2023-8-25,
for a premium of approximately $7.30.
If these options prove to be profitable prior to the earnings release, I would sell at least half of them.
Looking forward to read your opinion about it.

SNOW to 175Looking at SNOW (Snowflake Inc.) chart, that rising blue line suggests it’s on the upswing. If prices dip, I’m eyeing 151.50 as a likely support, where this line meets.
On a bounce, first stop for potential gains could be 163.62 where the 1st gap above fills. After that, watch out for 175. There’s another gap before hitting new highs for the year at 185.12 which could come by year's end.

SNOW another technology company tolerating Bidenonomics LONGSNOW on the 4H is seen trending from from earnings in May with the great top line
and okay bottom line with a big uptrend into a sideways wide range channel.
It is now low in the channel but still above the long term anchored mean VWAP which
is the logical stop loss for any long trade setup. Confluent support is the POC line
of the visible volume profile with the upper high volume profile providing the
the expected range of a long trade. The Volume Price Trend indicator
and the MACD are synergistic in their confirmation. Fundamentally, SNOW is in
the AI revolution and its role in streamlining processes and lowering costs for the government
and businesses. The logical target here, the second deviation above mean VWAP presently
at the 193.45 price level. This line pushed the price back down 4 times in the past 8 weeks.
I see the quick 10% upside as good for a long trade knowing well-managed options
trade could produce 100-150% easily in capitalizing on AI software tech and the heavy
hitters of the new NASDAC leading the index higher and faster. What a great concept
more snow while the climate heat wave is unrelenting. I will enter here with a sizeable
stock trade while considering a 10-30 DTE call option to catch the ride toward the
target mentioned here.


SNOW If market strength continue.. i believe SNOW is ready to test 200+ soon
weekly supply (red box) is my target.
MACD & TTM are bullish
PA is king so lets focus on that, it must hold 198-190 area

Finding Bottoms Using Monthly Inside Candles: SNOWThis past year, I shared many bottoms on names on my weekly WLs based on bottoming consolidation structures, mentioning a specific strategy as a reasoning for the trades. Aside from understanding price action, I used a simple method:
Monthly inside candles/bars.
----------------------------------------------
What is an inside candle/bar?
Inside candles trade “inside” its previous candle. The previous candle’s high and low can be used as resistance and support, respectively. Your trade execution comes on a break & hold above/below the range.
Here are a few examples of this:
pbs.twimg.com
----------------------------------------------
NYSE:SNOW
This has traded within it’s May ‘22 inside range for over a year. This has been one of my top watches earlier this year.
The range provides a macro resistance/support of $187.23 and $112.10, respectively. These levels can now be used as targets for your trades.
How do I execute on this?
Zoom into LTFs to find swing opportunities. In my 1/23/23 weekly watchlist, I provided NYSE:SNOW based on a previous bull div + key support/demand being held (red box).
pbs.twimg.com
All swing contracts provided on the WL printed, while NYSE:SNOW saw a massive upside move from $140 into $178.70 within 2 weeks.
You’ll also notice my invalidation for this was $133.10 while the low was $134.34. This invalidation was based on a breakdown of the range low.
Now once again, on 3/31/2023 I mentioned NYSE:SNOW as a potential high R:R trade.
Based on the exact same reasoning as my January WL.
Once again, NYSE:SNOW was able to hold its demand zone with a macro target of the monthly inside candle resistance.
NYSE:SNOW
The same exact entry & same exact analysis now provided a recent move into my $187.23 target. First move providing a 33% move, second providing a 42% move.
This is how you take advantage of macro inside ranges (specifically monthly candles in these examples).
pbs.twimg.com

SNOW - Rising Trend Channel [MID -TERM]🔹180 supported indicates a potentially POSITIVE reaction; a downward breach indicates a NEGATIVE.
🔹Technically positive for the medium long term.
Chart Pattern:
🔹DT - Double Top | BEARISH | 🔴
🔹DB - Double Bottom | BULLISH | 🟢
🔹HNS - Head & Shoulder | BEARISH | 🔴
🔹REC - Rectangle | 🔵
🔹iHNS - inverse head & Shoulder | BULLISH | 🟢
Verify it first and believe later.
WavePoint ❤️

Snowflake Head & Shoulders on the 4hrNYSE:SNOW This chart pattern of a 4hr H&S is quite prominent. So far so good if you're a bull you want to see this neckline hold. As the saying goes nothing is more bullish than a failed bearish move. If the neckline breaks it's trading back down to the 150s IMO. If it can hold I expect 190s to print. Based on the Modified Pitchfork I have if we chop around the 170s for the rest of the week I would lower the neckline down to 169 where the price would meet the 0.25 orange line, before considering the neckline broken. Big moves soon on SNOW is what I am expecting.

ScamflakeLooks like It's bottomed I think - for the more responsible operators stop is just below our last pivot - scam it.
SNOW stock is about to enter a consolidation state !SNOW stock is about to enter a consolidation state !
This chart shows the weekly candle chart of the euro against the US dollar over the past year. The graph overlays the recent bottom-up golden section. As shown in the figure, the euro against the US dollar hit its lowest point last month, just below the 2.382 level of the gold split, while its recent peak happened to be around 3.414 level of the gold split! This pattern indicates that the euro has entered a state of strong bearish positions against the US dollar, despite the fact that bulls have once again accumulated their strength! In the future, we should focus on whether the euro/US dollar can enter the standard graphic organization, and then determine the direction of the next breakthrough!

Snowflake? this overprice pltr wannabe should takea seat. lots of upside on this one if that turns out to have been accumulation targeting the previous highs isnt out of the question
