SPOT can still benefit from the ANTISOCIAL society of COVIDSpotify is still bullish and one it breaks out of the current consolidation it could push further up so it was worth keeping an eye on, with a new and more infectious variant of COVID we see many large economies becoming even more ANTI SOCIAL and this should benefit antisocial players in the world of equities.
SPOT trade ideas

HAVE IT ON YOUR PORTFOLIOPossible move: 70 %+
Reward/Risk:8 (R/R>3 is Ideal)
Time frame: 52 wks
This is just my technical view, not a fundamental comment..!
I can make you confused by a crowded messy chart, but I would rather simple effective presentations..!


SPOT falling wedge breakoutI am looking for a strong break and run again from SPOT potentially to ATH. As long as we do not break down out of the falling wedge, which will double as our stop, we can have our first target set at 322.26 followed by 333.30. The spreads are wide on this so be cautious. After 333.30, if we break that point we can see 342.5 followed by the ATH. This stock is not option very liquid with those options, so once again, be careful!


Long Spotify (Spot). Stop loss on a close around 314 or lowerSpotify has shown weakness this week. However, it is offering a great risk reward entry here around 316. Target top of channel

SPOT Elliot wave counting - trade with your own risk - ver 2SPOT seems is developing wave 3rd. The target for 3rd wave = wave 1 length * 1.618

SPOT Elliot wave counting - trade with your own riskThe 4th wave already happened, the price target for 5th wave = 1.618 from original point to wave 3 or wave 5th = wave 1 height.


US Stock In Play: $SPOT (Spotify Technology S.A)The successful breakout of $SPOT that was previously highlighted (a five months consolidated range pattern), have seen Spotify rallied to an all time high establishment at $346.44 on 11th December 2020. This breakout is also accompanied with its ATR (14D) peaking at $15 per day average volatility, signifying substantial attention of $SPOT from the Wall Streets at the moment.
This week, $SPOT have not been able to capitalize on the broad market rally, with an accumulated correction of -5% from its peak. The current immediate support to watch is at $312 this week.

Spotify - Possible To $400 ?i thought spotify could be best stock to invest in 2021.
etoro : faizfakhirin


SPOT Short OpportunityHello traders !
As you can see,price is in a long-term upward move. Now we have some sellers in action which has formed a rising wedge pattern. If my prediction is correct,then we could see also a double top formed on H1 timeframe. I expect price to fall to its nearest support level,which is also in a combination with 0.50 fibonacci level. Also RSI shows some divergences on the lower timeframes

Retracement to 310-300, then new upswingSpotify ran +42% since last reversal. It's currently overbought on RSI, and the current price is too far away from EMA20.
I see a -13-15% retracement, then a new upswing. Be patient.

Spotify (SPOT): A Technical Approach Using Elliott WavesIn this analysis, I'll be taking a purely technical approach in analyzing Spotify (SPOT), using Elliott wave counts.
Analysis
- We can see that overall, the stock is in a clear uptrend
- It has completed wave 2 on the primary degree, and continues to rally through impulse waves
- It formed an Elliott triple combo wave (WXYXZ) for the second primary wave, consolidating within a mild megaphone pattern
- While it seems like the momentum has topped out for now, as we wait for the fourth wave on the minuette degree, we could expect a bounce near the ichimoku cloud support
- We could anticipate the last impulse wave on the minuette degree ending near the 1.618 fibonacci retracement resistance, near $376
- This would also mark the completion of the first impulse wave on the intermediate degree
For educational content regarding Elliott Impulse Wave counts, check out my previous post below:
If you like this analysis, please make sure to like the post, and follow for more quality content!
I would also appreciate it if you could leave a comment below with some original insight :)


$SPOT looking to breakout againIt has had a huge move post breaking the $293 resistance area. Now after consolidating for 2 days, it looks set to break out above $342 area to target $360 - $365 in coming days.

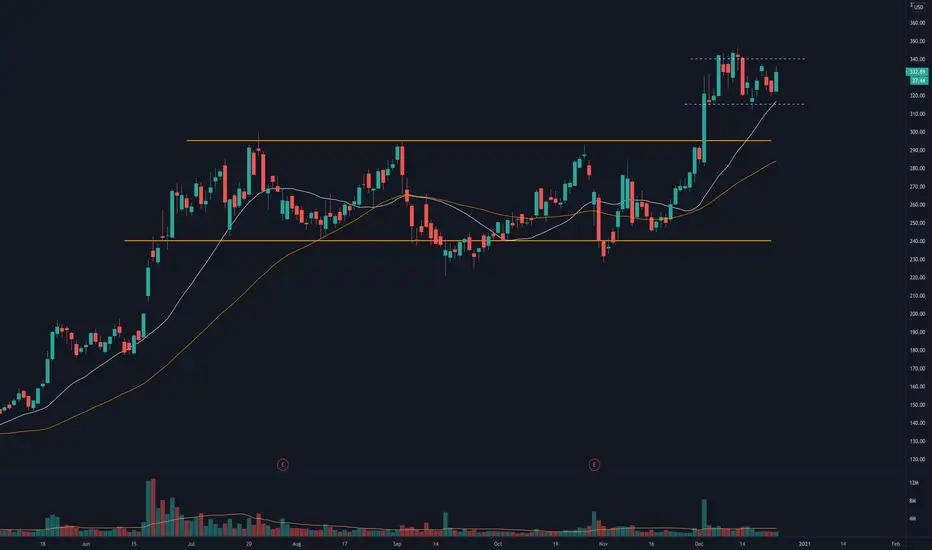
Why multi-month patterns are more successful (SPOT)It is easy to get caught up in the idea of getting a bunch of small winners is the best way to grow an account. This is because of the rush you get when a win occurs. The more often it happens the better you feel. In reality, this works against the trader's odds because you have to win more often and have to be more accurate. What I want to focus on are the long term patterns. over the course of several months. These trades tend to net more profit and cause less stress for the investor because they take less maintenance and effort to trade. The win ratio can be smaller on these trades because the profit is larger.
This chart of Spotify (SPOT) is a perfect example of a macro (long-term) multi-month chart patterns that paid out huge profits. This ticker has had a history of macro breakouts most recently a few days ago. The price really follows the moving averages well and consolidated under a clear price of 292. There are a few things you want to look for when trading macro patterns.
1. clear support and resistance lines. in this case, 292 is resistance, and 245 is support. These levels are easily marked and tracked. One could even buy at support for these trades and sell closer to resistance.
2. Volume is king. A low volume name is never going to leave its range. SPOT has tons of volume being a tech name that has huge popularity. I usually look for names that have one million in shares volume per day.
3. For a breakout to be confirmed it needs to attempt the resistance price AT LEAST 3 times. The third time is important because it's a psychological tipping point for most traders and algos.
I like to refer to these as layers of probability. The more you have the more likely a trade is to work in your favor.

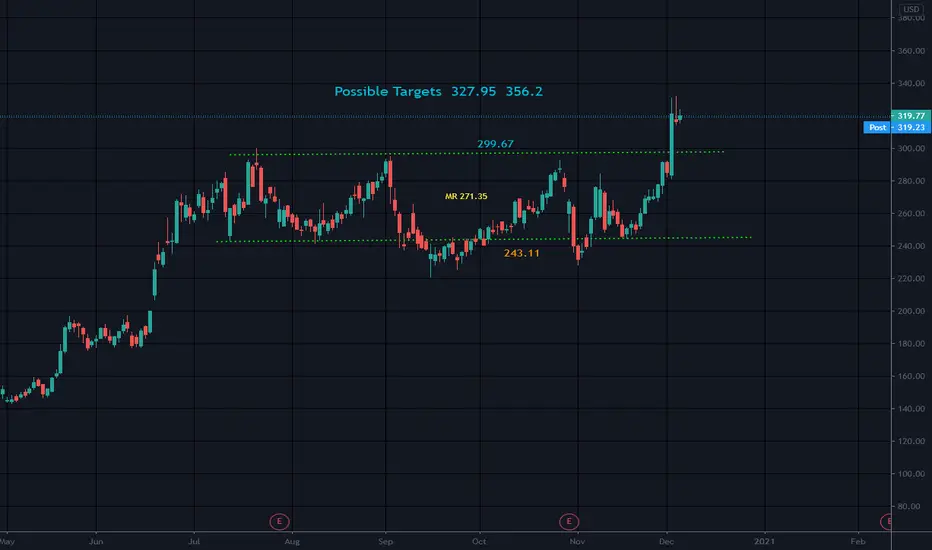
Broke Up from RectangleRectangles are like S triangles and are often a continuation pattern..
This one broke upside, sometimes they can be drawn back in to the rectangle though..this one looks to have momnetum on it's side..
The top trendline of the rectangle which was R now becomes support..
MR- Mid Rectangle..
Not a recommendation