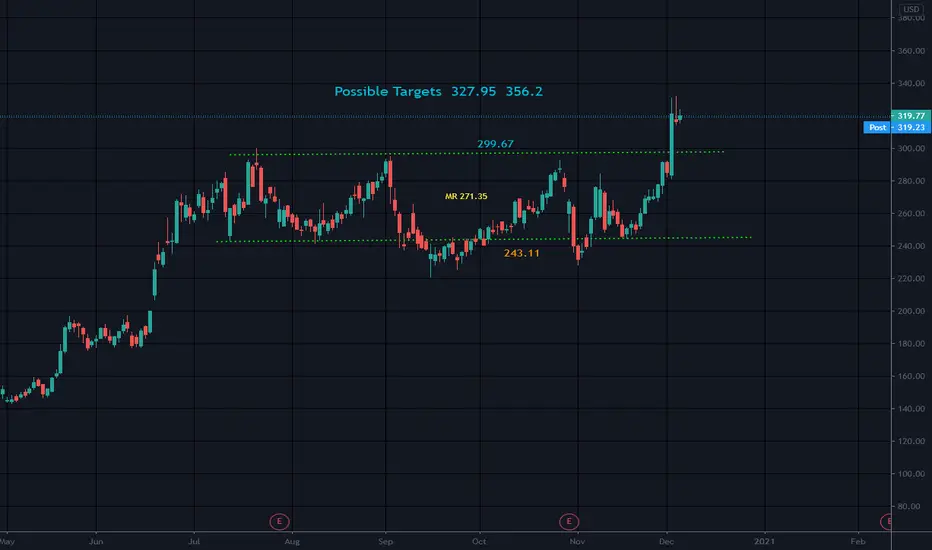
Broke Up from RectangleRectangles are like S triangles and are often a continuation pattern..
This one broke upside, sometimes they can be drawn back in to the rectangle though..this one looks to have momnetum on it's side..
The top trendline of the rectangle which was R now becomes support..
MR- Mid Rectangle..
Not a recommendation
SPOT trade ideas
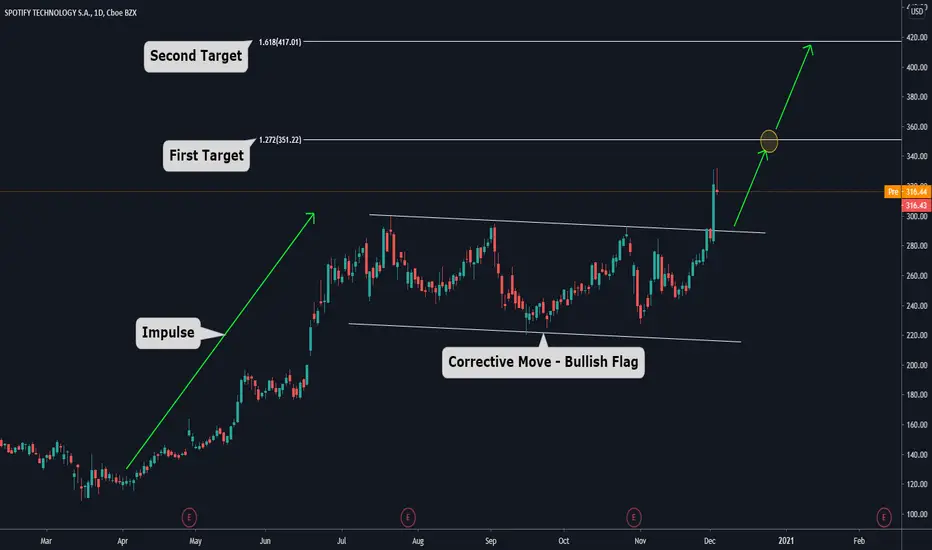
Expecting a +30% Move on Spotify in the Short TermGood morning traders! Today we want to analyze Spotify, since in recent days much has been said about this stock and its movement in recent weeks has been remarkable.
🔸What we can observe is that from March to July of this year the price generated an astonishing rise of approximately 170%.
🔸Of course, after a strong move, a consolidation or correction of a similar magnitude is expected.
🔸So it was, the correction lasted approximately four months, and we can draw a flag pattern of this process.
🔸This week there was a clear and indisputable breakout to the upside, with a large bullish candle closing above all-time highs.
So, how do we project the target of the movement in this case that the price is at historical highs?
🔸The tool we use is the fibonacci extensions based on the previous momentum. This projection gives us that the first target of the movement is approximately $351 and the second target $417, which would be, from the current level, a rise of 30%.
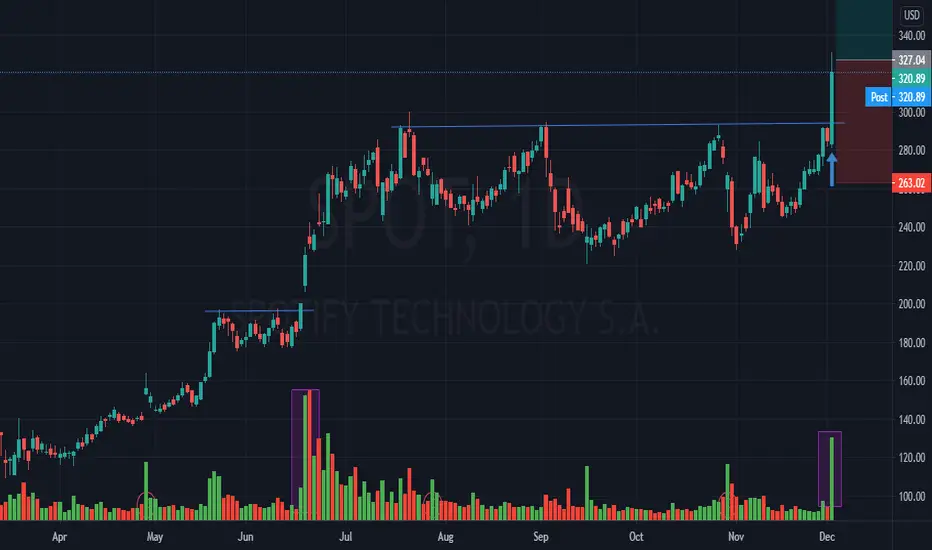
US Stock In Play: $SPOT (Spotify Technology S.A)$SPOT have broken out of a five month ascending triangle (consolidated) pattern, rallying to an all time high untracked prize zone. This breakout is accompanied with substantial volume exceeding 300% of its 50 days average.
At the current closing price of $320.89, $SPOT is slated to sustain this rally towards $380 (Fibonacci Projection), a modest +18% away from today.

SPOT Potential Short PlayNYSE:SPOT
Wait for confirmation 12/3 or 12/4 for a bearish or bullish behavior before making a decision.
Anticipating a slight price rejection at an all-time high of $330

BREAKOUT CUP WITH HANDLE AND HIGH VOLUM BUY SPOT ABOUT 327$Spotify launches '2020 Wrapped' with new features including quizzes, badges and, yes, stories
1% CAPITAL
SPOT sporting a nice lookSPOT looks poised to breakout soon. This will be the 4th time testing 300. A break above could lead to a nice upside move.


SPOT is about to run. PT 380The bull flag on the daily and weekly indicates a bit of consolidation. The break is on the way. For my Target of 380, I used the length of the pole. This should be a 1 month out swing. Let's see how it goes!

looks like a possible head and shoulders breakoutSPOT looks to have formed a head and shoulders. Could see a breakout.


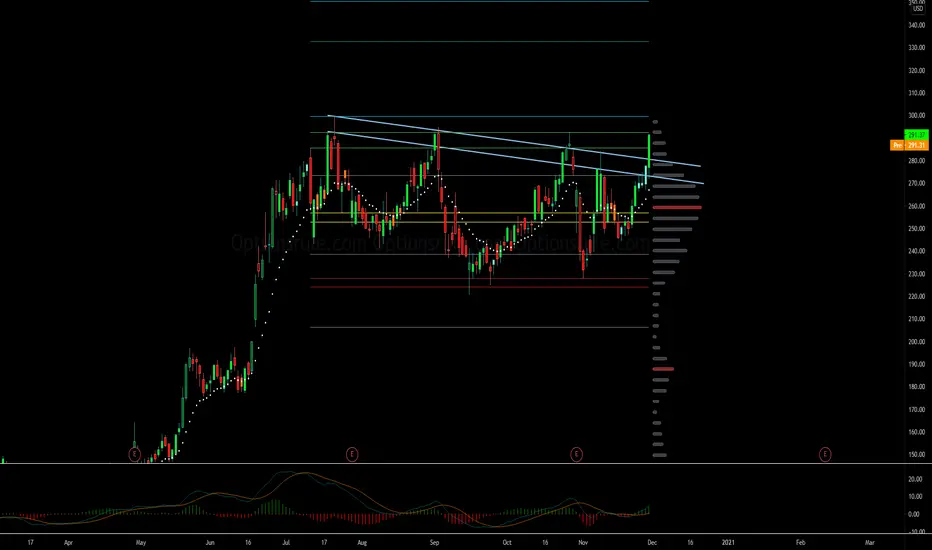


Spotify - Daily ChartTechnical analysis of Spotify on daily chart. All explanations are done on the chart.
---
Disclaimer: All content provided here is for informational and educational purposes only and should not be construed as professional financial advice. Should you need such advice, consult a licensed financial or tax advisor. No guarantee is given regarding the accuracy of my technical analysis and any information here.
Legal Disclosure: I’m not a financial advisor. The information contained here is for entertainment purposes only. Before investing, please consult a licensed professional. Any stock analysis provided here should not be considered “investment recommendations”. I shall not be held liable for any losses you may incur for investing and trading in the stock market in attempt to mirror what I do. Unless investments are FDIC insured, they may decline in value and/or disappear entirely. Please be careful!


SPOT over $274.20Large symmetrical triangle forming, continuation of the current price action can break out.

testing resistance for fourth time's the charm?the sun will shine and we will try again, am i right?


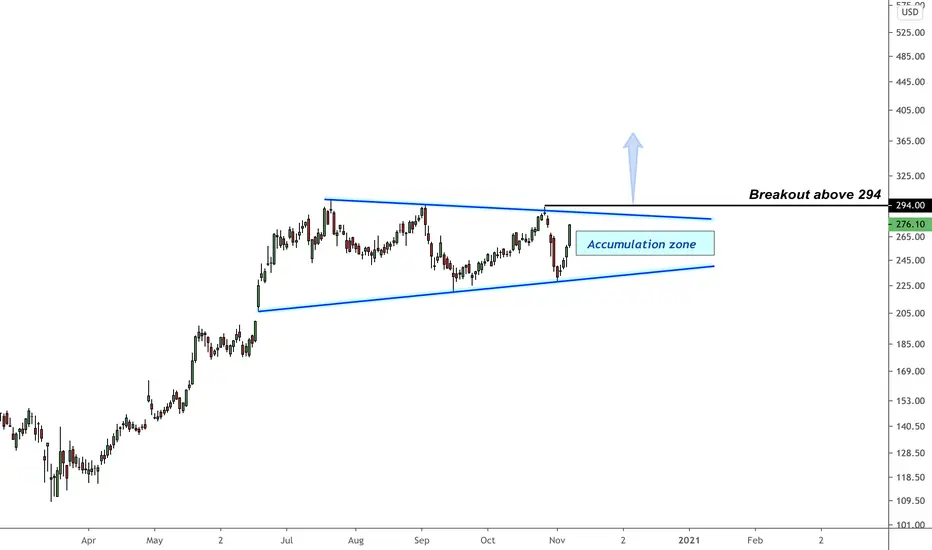
Spotify: Bullish pattern forming Multi-month consolidation in Spotify could be interpreted as a symmetrical triangle. I'm looking to buy in the accumulation zone or the breakout above 294.
Spotify Ascending Wedge- 22% Long positionOn the 2hr chart there is an ascending wedge where spotify is clearly trading in between. If all goes well, it should bounce off the bottom white line of the wedge, if not it should bounce off around the yellow support line (in theory). If it bounces from the white support line we can expect a 22% gain in a long term position.
My idea of a swing trade would be:
1. Would buy before the white support line and sell at the top.
2. Stop- loss just beneath the yellow support line
What do you think?
