SPOT trade ideas

SPOT - IMPULSE ON MOONSpotify has made a NUMBER of deals lately, honestly I couldn't really get a wave-count till now. SPY is on it's last legs finishing it's primary impulse wave arounf $250 per share, time-line may be sooner rather then predicted as this thing is going parabolic.
Price target: $250 Range
Local Support: $222.83
Will update with corrective predictions when we get there, see you fellers on the moon.


$SPOT - Bull flag breakout - Potential target $230A nice bull flag breakout with good volume. 20EMA ($181) level can be used as Stop loss.


Spotify Technology multiyear breakout Stock closed at a All Time High and continues to move higher after-hours.
This is a breakout from a 2 year range and has strong fundamentals and technical s
to drive it much higher.
$225 is the first major Fibonacci target to consider.
RSI has room to run, as has the MACD which is reversing bullishly.


💿 Anybody Use CDs Anymore? (SPOT)🤔 Very critical crossroads of two major support levels for streaming platform Spotify.
Key focus is the red circle, 177.94. If broke I'd look to short as that would break horizontal and upward channel support. Could lead to a drop towards 156.
I would watch this on a 3 hour timeframe to see if it wants to curl or break based on the Crossover strategy and the ema dots indicator. Pat attention to the candle, engulfing vs doji will show you what to play.
If curls and Crossover take place we look to move towards the top of the channel towards first level of 195.47. We test that for a breakout to go to new highs.
Best of luck to you! 🎲🎲
🥇MLT | MAJOR LEAGUE TRADER


Spotify in a precarious positionThis flag to me says we probably go lower. But it might also resolve to the upside. If you are long Spotify stop loss is 175...


Spotify Enters Post-Rogan EraSpotify's has returned to the initial jump price after Joe Rogan's 5/19 exclusive deal announcement. This price of around $178 correlates to both to the significant volume traded on that day and to the 38% Fibonacci entrancement zone. Moving forward, this will be a significant new support level as investors contend to Spotify becoming a dominant player in podcasting. Go long.

Spotify + 9 Other Stocks I Would Get if I were to do a LongFirst off, please don't take anything I say seriously or as financial advice. As always, this is on opinion based basis. That being said, I wanted to do a long six month to 1 year stock pick strategy just out of boredom. Now, if I am right about this post some of you might get really excited. My picks include: Spotify: Expect it to grow due to the Joe Rogan deal and video integration | Guess: On the next wave correlation for a long | ACB: Aurora is expected to have both short and long potential, especially given there expansion strategies | PluralSight: An increase of market demand in their market segmentation and how they are expanding digitally | JD.com: For an Alibaba competitor, they are still quite under rated and have strong financials overall | Trip Advisor: Going to continue expanding digitally, especially if they retrace post-Covid, safer bet than many hotels and airlines given they are in the tech space without need for lots of real estate | GBTC: Institutional investors are going to be more interested in it as a trust, though I prefer Bitcoin over some trust | Tesla: Tesla will continue expanding given Elon Musk must work to beat production quotas. It is in my opinion that Mr. Musk will perform in that aspect | CloudFlare: Stable growth overall, quite bullish on its category | PFE: Pfizer is one of those stable stock picks for the pharma category. Now this being said, I have done these stock picks all for specific reasons, and I picked 10 so if someone wanted to do a split diversification it could be easier. Again, this is on an opinion based basis and not meant to be taken as financial advice. Invest at your very own risk.

Joe Rogan already made Spotify $3.22 Billion + the FutureFirst off, please don't take anything I say seriously or as financial advice. As always, this is on an opinion based basis. That being said, here are a few insights. Since Spotify was already mostly on a bullish run, and the market had a chance to retrace from most of the noise, I am using a $160 to $180 price as a metric not $190. If you look at 20/160 you get 0.125. Now I am going to multiple by 0.78 as hype multiple rather than attributing all that growth to just the deal. 78% is still way too generous, but I think it is decent given how popular Joe Rogan is. 0.125*0.78 is coincidentally right on 0.0975. I multiple that by the current market cap and get 3.22452 billion. I seen this YouTuber do a video saying the Joe Rogan deal made Spotify $5 billion. Personally, I understand the reasoning behind his metric, but he didn't consider Spotify was already bullish and that not everyone trading Spotify are Joe Rogan fans. He also didn't give a decent shortening or reaction time. Joe Rogan contributed to the a major push in the rally continuation. I think it is fair to say around a 78% push pre contributing to sentiment reaction. Also Spotify's ROI for a $100 million dollar deal is 32x in a short time period which is for every $1 you have $32. That means literally 3100%. If Spotify made the same deals every 11 days or so, and profit kept compounding over and over again a year, that would be an annualized ROI percentage of 14,847,931,113,934,977,527,395,976,847,246,204,891,384,177,320,001,536%. That means that a deal like this is extremely rare . Spotify made one of the best partnership deals a content platform could make, and likely they wouldn't be able to find creators that popular in which they can offer that same amount too for a really long time. Untop of all this, Spotify said they want Joe Rogan's clips migrated to their platform. I myself am a creator who posts content on Spotify. If Spotify decided to allow video integration, it can easily even annihilate companies the likes of the size of YouTube. CEO Susan Wojcick's management of YouTube included higher attention to many mainstream media sources over small creators (trying to be cable competitive). YouTube also been having a broken content management and Copyright system for a while in many creator's voiced opinions. The whole way things played out is most likely YouTube ruined its edge factor and didn't differentiate itself. Joe Rogan was probably already planning an exit, and Spotify found an opportunity due to what one can call a competitor's lackluster management style. I think a realistic target in the future if Spotify starts rolling out video updates and doing all this is a long target of $325 within a year or so. It would be interesting to see how that plays out.


SPOT - Is there a recovery going on? As a technology company Spotify is making Bulls and taking profit of the COVID-19 situation. There's a strong market for how higher prices as we look at volume compared to price.
Will there be a recovery the next coming months, will Spotify keep up with this bull? Let's see how this turns out.


$ABT $AMGN long & $NTES $SPOT shortAnother 4 tickers for your watch list.
I am surprised to see how many short trades are showing up on a day to day basis. Very few Long setups. *******Eyes open for Sector Rotation******* If the market breaks out.... I

$SPOT short term puts @hereRSI over 70 and rolling over. SMI just flipped. Joe Roagn deal is huge and this ran hard on news. Looking for pullback at least down to 186 -187 range.
Purchases 2 May 29 P 192.5 @ 4.80 a contract

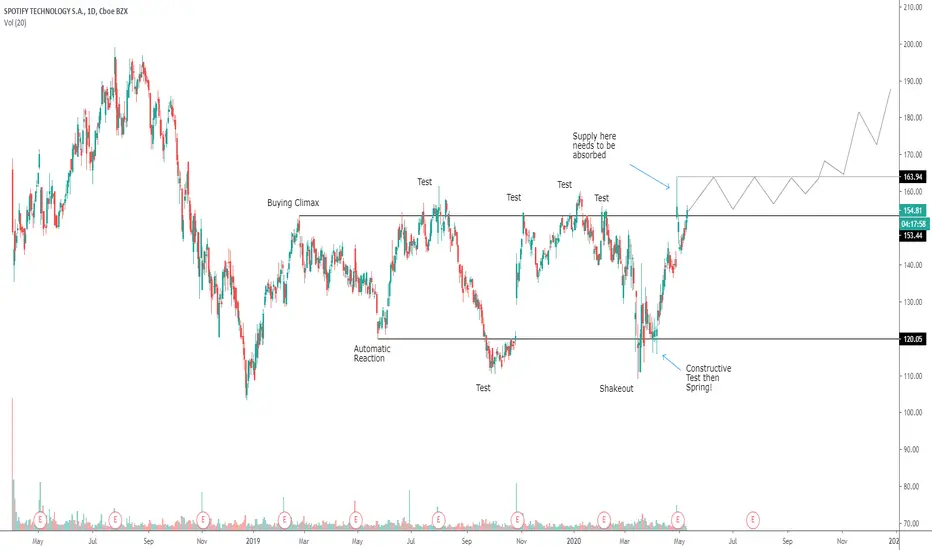
Bullish Case for SpotifyPotentially entering Phase D of a Wyckoff Accumulation Structure. Starting to see decreased supply on earnings reactions. Supply here needs to be absorbed, if that happens I predict higher prices.
SPOT is heading downSPOT is currently way overbought and last time it reaches this level it dropped $20 so it could possibly drop that or more. If your looking to buy SPOT wait for the pullback to happen then scoop it up at prime price. PLEASE COMMENT WHAT YOU THINK!
