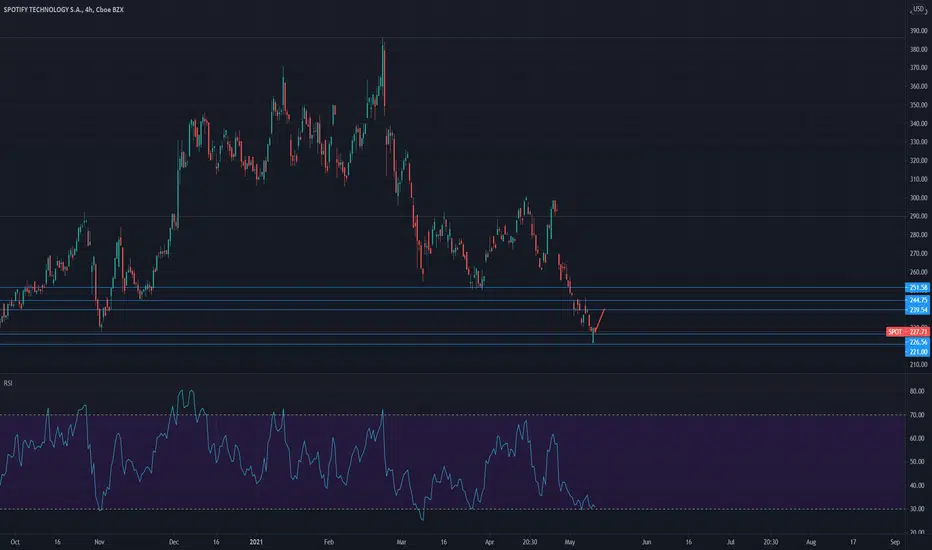
SPOTIFY SHORT?Head And Shoulders Pattern (not confirmed)
At the moment we have the 400 SMA support and right below that the 220.56$ support line (neckline).
As long as we have no closed candle under the neckline we don’t need to worry about lower prices.
If we get a closed candle under the neckline we could have a bullish-to-bearish trend reversal.
SPOT trade ideas

$SPOT Bullish Inverse Head and Shoulders & Bull FlagSPOT formed a bull flag while retesting the neckline of the bullish inverse head and shoulders. I expect price to break out of this flag to the upside.
Earnings are 7/30, In 7/30 260C @ $3.60


SPOT 20% to 60% short after earnings report if not big surprise?DISCLAIMER: I'm not a certified or licensed financial advisor, securities trader, or securities broker; and, this is not intended as financial or securities advice.
DISCLOSURE: I own shares of NYSE:SPOT
Trend behavior looks to me like pricing-in ahead of missing a big surprise from the upcoming earnings call, anticipated on July 28th. Even the 37% surprise in April was met with a $55/share price drop. The lower support for the past few years looks like $133-$100 range, with a recent support range between $230-$215.

SPOT (update every week)A correction is necessary for go up again, so:
Short term 📉
Med term 📈,
The best zone for bought it is the red zone, be careful!


SPOTLooks like it's being accumulated and preparing to spring up. Could get a nice 15% to 25% bounce.

SPOT afterhours 26 June 2021 Gap Fill AnalysisAfter 28 April 2021 earnings SPOT gapped down from 292 to 269 and then saw a long downtrend to lows of 220. They did start to pick up and closed at 266 range. Looking for a push past 269 before entering my trade, looking for a possible gap fill play. On the downside, we did see a gap up this week from 255 to 265, so if we do end up reversing and falling under 265, we could be looking for a retracement down to 255 to fill in that gap up before running back up.
I am just watching SPOT right now as we head into Fourth of July weeks and trading volume could be increasing or decreasing as people are starting to go on vacations for the holiday weekend. We will have to wait and see what SPOT does come premarket Monday morning and throughout the week.

Spotify for possible long I've been Watching Spotify for a while now but I've been undecided on it but am about to look for long opportunities however this is now an aggressive trade for me..... Only take if you see what we see come join us if you see it too...... Like and follow page


SPOT on supportPerfect support for mid-term long position. Entry point @ $220-225, TP $250-300-340, SL $210.

Long SpotifySpotify is rebounding from a strong support. I like this set up on a strong chart like the weekly one.


$SPOT Bullish reversal. $257.50 takes us to the next leg up.$SPOT Bullish trend reversal. Breaking above the trend lines and approaching and area of contention. Approaching 50 EMA, 200EMA and horizontal resistance Closing above $257.50 gives us room to take our next leg up. Under analysts price targets and ARK recently increased position.

Spotify $SPOT | Bullish Inverse Head and Shoulders$SPOT formed a bull flag below the inverse head and shoulders neckline.
Watch for continuation to the upside.
Targets: $250, $260, $270

SPOT LONGSPOTIFY (SPOT) is testing a huge resistance level that has touches months back. Has a gap fill potential which is a ways away but not out of reach for a stock like SPOTIFY. QQQs are attempting to break into all time highs and if it breaks out into blue skies SPOT can see huge demand over the next week or so.


SPOT setting up for breakout over 232Daily and Hourly candles tightening up.
Once breakout is confirmed should see higher if market cooperates.

SPOT potential reversalSPOT - Friday was the first green inside day in a while. Hopefully Monday will tell us if it's an inside day to reverse up or down. The June 280 calls are actually not bad for a potential lotto. I might look at those if we reverse here.

SPOT| Potential Inverse Head & Shoulders for an Earnings popHey all,
In purely technical terms, Spotify is preparing for an inverse H&S breakout back to ATHs.
Earnings tomorrow morning could be the catalyst for this breakout.
Fundamentally however, I'm slightly torn on the prospects of a beat and raise, as I doubt the fact that they will have kept up revenue growth to levels that will justify current Market Cap.
Interestingly the 295$ level has been previous resistance, support, and then resistance again over the past year or so.
Any thoughts on which scenario is most likely come tomorrow mornings ER?
Good luck to all!
(*This is not financial advice, for sake of discussion and illustrative purposes only*)