TRV trade ideas
Travelers repeating patternHey everyone,
as you can see there is a repeating pattern (triangle) and the fibo levels and timezones help to predict what the price could do in the next 2 weeks. I would wait until the price hits the support line (purple) and then go with a long.
Entry: 115$
Stop: 112.50$
Goal: 136.50$ - 142$
CRR: 7.9
Much fun with that trade!
Leave a follow please, trying to hit 200 :)
TRV - Looking lowerAfter an earnings miss in late October (10/22) which saw the stock trade 8% lower, TRV has slowly trudged higher and has recovered half of that loss over the past two months. That being said, we are starting to see signs of waning buying pressure. Since the beginning of December(12/2 high of 137.26), TRV has been tracking sideways in what looks like a retest of the breakdown from October's earnings call. I cannot rule out a subsequent move higher to test the upper portion of the breakdown (the failed support just above $142) but it looks as though we may be presented with a decent short setup at current levels. Specifically, the action on 12/20 stands out: volume expanded to its highest level since Oct earnings (and highest volume day of the year outside of earnings) and closed well off the highs; although there was a big gap up, TRV closed down 3bps on the day. Also, and equally important, this move created a false break above the 12/2 high and then saw 3 consecutive days of weak closes. Ideally we would see an uptick in volume accompanied by a nice down bar to indicate a healthy dose of supply but with holiday trading conditions it may have to wait a week or so. I'm waiting on confirmation with the prospect of a better entry up around $142ish but I wouldn't hesitate to jump on a short with an overtly bearish day/closing bar. Let's see how this turns out, I'll update when more is revealed.
TRV Potntial Short 5th Wave Swing Trading OpportunityUsing our Elliott Wave Indicator Suite for the TradingView Platform we have identified a potential Short 5th Wave Swing Trading Opportunity on TRV. The 5th wave move in an elliottwave sequence is the highest probability move.
The wave 4 pull back after the earnings gap down has found resistance in the green zone of our probability pullback zones, which represents an 85% probability that our automated 5th wave target zone, in blue on the chart will be hit.
We see yellow dots formed in the oversold zone on our special False Breakout Stochastic indicator, which signals strong Bearish momentum. When, during a wave 4 pullback, the stochastic pulls back against these false break out dots and crosses in the overbought zone, there is a high probability the stocks price action will resume the overall bearish trend.
We also measure the wave 4 behaviour with our Elliottwave oscillator, which has pulled back within our pre-determined zone.
So overall we have identified, using our Elliott Wave Indicator suite for TradingView, a high probability short swing trading opportunity on TRV with the following entry strategy:
Short entry through $132.22
Stop Loss $136.22
Target $126
Giving a Risk to Reward over 1:1.6
Learn more about our Tradingview indicator suites by watching the video tours >>HERE<<
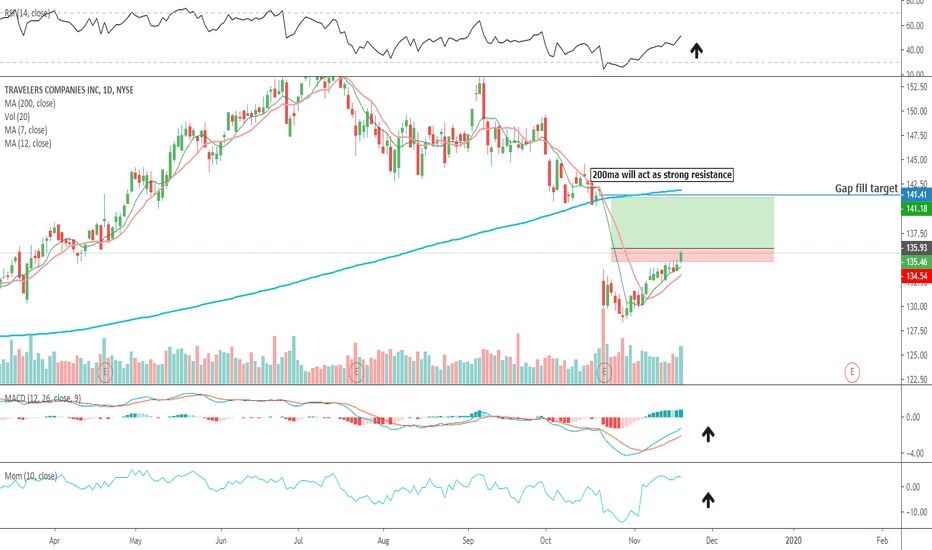
Travelers Bullish Reversal. Entry level $135.93 = Target price $141.18 = Stop loss $134.54
Indicators are bullish and pointing to gains ahead.
Very reasonable 15 P/E ratio.
Good yield at 2.42%.
Company profile
The Travelers Cos., Inc. is a holding company, which engages in the provision of commercial and personal property and casualty insurance products and services. It operates through the following business segments: Business Insurance; Bond and Specialty Insurance; and Personal Insurance. The Business Insurance segment offers a broad array of property and casualty insurance, and insurance related services to its customers. The Bond and Specialty Insurance segment includes surety, fidelity, management liability, professional liability, and other property and casualty coverage and related risk management services. The Personal Insurance segment consists of products of automobile and homeowners insurance are complemented by a broad suite of related coverages. The company was founded in 1853 and is headquartered in New York, NY.
Analysis of TRAVELERS 7.06.2019The price above 200 MA, indicating a growing trend.
The MACD histogram is above the zero lines.
The oscillator Force Index is above the zero lines.
If the level of resistance is broken, you should follow the recommendations below:
• Timeframe: H4
• Recommendation: Long Position
• Entry Level: Long Position 150.50
• Take Profit Level: 153.00 (250 pips)
If the price rebound from resistance level, you should follow the recommendations below:
• Timeframe: H4
• Recommendation: Short Position
• Entry Level: Short Position 147.50
• Take Profit Level: 146.50 (100 pips)
USDJPY
A possible short position in the breakdown of the level 108.00
GOLD
A possible long position at the breakout of the level 1340.00
USDCHF
A possible short position in the breakdown of the level 0.9870
EURUSD
A possible long position at the breakout of the level 1.1280
TRV monthly chart has a huge MACD divergenceThe MACD divergence on the long term chart of TRV indicates prices should be near the $128 level. The topping pattern forming on the daily seems to add credibility that this move is over. The daily chart closed near the low today and the MACD on daily is diverging down. Those who follow other time frames will note the weekly while in a large double top too of course, has no MACD divergence. No point in fighting the tide on TRV though. Will look at some puts tomorrow not too far out of the money.


