Key levels for TeslaNASDAQ:TSLA Tesla has reached a support zone "274" and bounced back. Given the close above the first support"294.80", it is expected to rise toward the key resistance area "331"
TSLA trade ideas

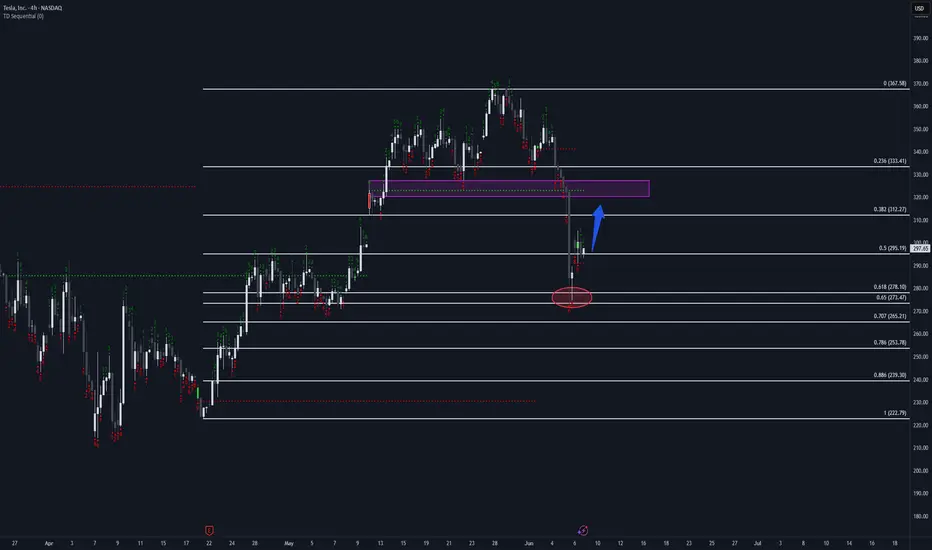
Tesla to re-test the 320 levelTesla bounced off the 0.618 fib level and wicked above (bullish).
We have a double red 9 on the 4 hour.
Looking for a recovery bounce to 315-320 level.
TSLA: Uptrend channel bounce, trading between 50 and 200-day SMAHey guys/gals!
So we all know that Tesla took a massive drop last week. It fell about 14%, and was down even 3% after hours at one point. I think we can all agree this crash wasn't technicals driven - it was clearly headline impacted. This was a clear black swan even t, and even in my case, nothing like this has ever happened to me as a trader. It was unforeseeable, forced me to hedge overnight and I'm still having nightmares (lol). Definitely one to remember as I don't think something like this would happen with any other stock. Tesla is truly unique in this sense.
But looking at the bigger picture, the bounce that we experienced on Friday must've been technicals driven, and psychologically influenced, as I am almost certain that the crash was a massive overreaction. People woke up the next day and thought this was severely discounted over a couple social media tweets (I won't go into the politics of things).
As you see on the chart, Tesla may in a new upward channel. At first I figured this may be a bear flag, however due to the upcoming catalyst like the Robotaxi launch - this would likely only be a bear flag if prices crashes below the lower support trend line.
As long as price is within the channel, I'd say things are holding up. We'd likely see a jump towards the upper side of the channel - however it's important to note that $300 and £360 are major resistance points. Robotaxi launch and any future tweets will definitely move price, and I think those will be a factor in determining whether price goes up or crashes below the trend line.
Another thing to point out is that price is currently trading between the 50-day and 200-day moving averages. The 50-day SMA is acting as vital support, whereas the 200-day SMA is the resistance. If there is a break above the 200-day SMA, price will likely go higher. The opposite may happen if price crashes below the 50-day SMA.
Either way, headlines and technicals mentioned above will continue to influence price.
Note: not financial advice.

When Intuition Beats the Algorithm█ When Gut Feeling Beats the Bot: How Experience Can Improve Algorithmic Trading
In today’s world of fast, data-driven trading, we often hear that algorithms and rules-based systems are the future. But what happens when you mix that with a trader’s intuition, the kind that only comes from years of watching charts and reading price action?
A recent study has some surprising results: A seasoned discretionary trader (someone who trades based on what they see and feel, not just rules) was given a basic algorithmic strategy. The twist? He could override the signals and use his instincts. The result? He turned a losing system into a winning one, big time.
█ What Was the Experiment?
Researchers Zarattini and Stamatoudis (2024) wanted to test whether a skilled trader’s experience could boost a mechanical system. They took 9,794 stock “gap up” events from 2016 to 2023, where a stock opens much higher than the day before, and let the trader pick which ones looked promising.
⚪ To make it fair:
All charts were anonymized — no names, no news, no distractions.
The trader had only the price action to guide his choices.
He could also manage open trades — adjusting stop-losses, profit targets, and position sizing based on what the price was doing.
⚪ The Trading Setup
█ What Did They Find?
The trader only selected about 18% of all the gap-ups. But those trades performed far better than the full list. Here's what stood out:
Without stop-losses, the basic strategy lost money consistently (down -0.25R after just 8 days).
With the trader involved, profits rose fast, hitting +0.80R just 4 days after entry.
Risk was tightly managed: only 0.25% of capital was risked per trade.
⚪ So what made the difference? The trader could spot things the system missed:
Strong momentum early in a move
Clean breakouts from long sideways ranges
Patterns that had real follow-through, not just random gaps
He avoided weak setups and managed trades like a pro, cutting losers, letting winners run, and trailing positions with smart stop placements.
⚪ Example
An experienced trader can quickly identify a breakaway gap, when a stock gaps up above a clear resistance level. Unlike random gaps, this setup often signals the start of a strong move. While a system might treat all gaps the same, a skilled trader knows this one has real potential.
█ What Does This Mean for You?
This research shows that trading experience still matters — a lot.
If you’re a systematic trader, adding a discretionary filter (whether it’s your own review or someone else’s) could drastically improve your results. A clean chart read can help you avoid false signals and focus only on the best setups.
If you’re a discretionary trader, this study is proof that your skills can add measurable value. With the right tools and discipline, you don’t need to throw away your instincts, you can combine them with structure and still win.
█ Key Takeaways
⚪ Gut feeling isn’t just noise, trained instincts can spot what rules miss.
⚪ Trade selection matters more than just following every signal.
⚪ Managing risk and exits well is just as important as picking good entries.
⚪ Hybrid trading, rules plus judgment — might be the most powerful combo.
-----------------
Disclaimer
The content provided in my scripts, indicators, ideas, algorithms, and systems is for educational and informational purposes only. It does not constitute financial advice, investment recommendations, or a solicitation to buy or sell any financial instruments. I will not accept liability for any loss or damage, including without limitation any loss of profit, which may arise directly or indirectly from the use of or reliance on such information.
All investments involve risk, and the past performance of a security, industry, sector, market, financial product, trading strategy, backtest, or individual's trading does not guarantee future results or returns. Investors are fully responsible for any investment decisions they make. Such decisions should be based solely on an evaluation of their financial circumstances, investment objectives, risk tolerance, and liquidity needs.

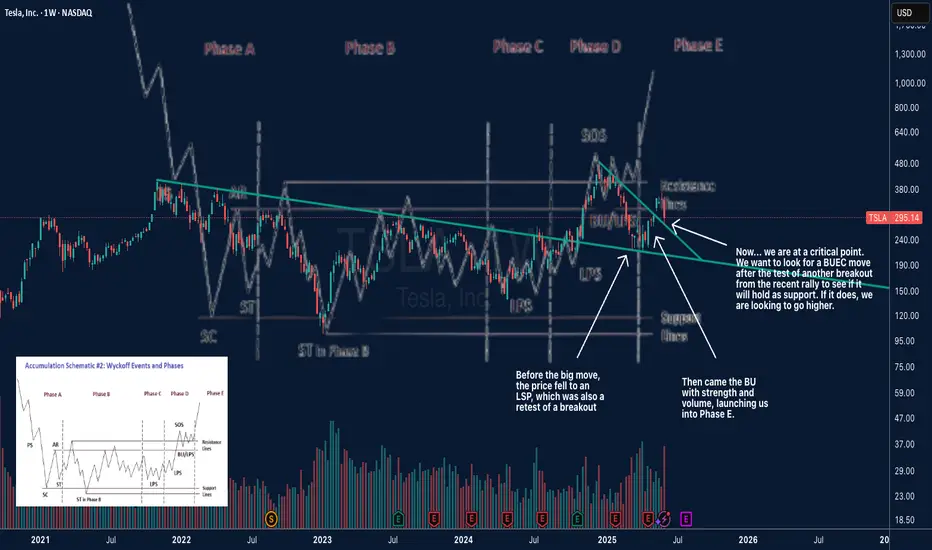
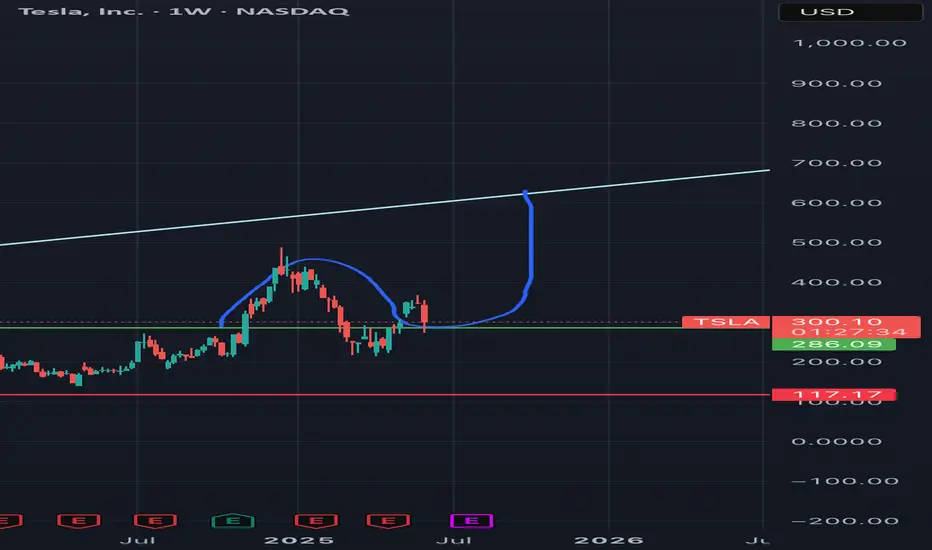
Is Tesla telling a classic story right on its chart?This looks like a textbook example of Richard Wyckoff's "Creek" analogy. For months, the stock faced a "creek" of selling pressure around the $280-$300 resistance line, turning back any attempt to move higher.
Before the big move, the price "backed up" to a Last Point of Support (LPS) to gather steam—that was the dip we saw back in Phase D. Then came the powerful "Jump Across the Creek," a breakout with strength and volume, launching us into what appears to be Phase E.
But the story isn't over. The sharp pullback we're seeing now isn't necessarily failure. It's the critical "Back-Up to the Edge of the Creek." The stock is testing if the old resistance (the far bank of the creek) will now hold as new support.
The question now is: Does the ground hold for the next launch higher, or does the price fall back into the water? This is the moment of truth.
Bullish on TSLA if its stay above 290$ USD**INDICATOR SAY BULL🚀 TESLA (TSLA): The Ultimate Showdown – Bullish Surge or Bearish Collapse? 🚀
Tesla (TSLA) has all eyes locked on it , standing at a crossroads that could dictate its next explosive move. Hovering at $295.14 USD , it’s holding onto the crucial $290 USD support level , a make-or-break zone that could either ignite a spectacular rally or trigger a sharp decline.
🔥 Bulls Are Ready to Take Off: If Tesla defends $290 USD , it’s GAME ON. This level acts as a launchpad—a pressure point where accumulation fuels momentum, setting the stage for a surge toward $460 USD. Investors, traders, and market enthusiasts are all watching for this breakout moment, knowing that breaching higher resistance could spark an avalanche of buy orders. Tesla’s chart suggests a brewing storm of demand, one that could shatter expectations and push the stock into new highs.
⚡ Bears Are Lurking in the Shadows: But danger is never far away. A slip below $290 USD could signal the end of bullish dominance, dragging TSLA into a downward freefall toward $220 USD or even $200 USD . This break would suggest weakening momentum, market hesitation, and potential large-scale selling pressure. Bears will seize the opportunity, forcing Tesla into a recalibration phase—one that could reshape investor sentiment for weeks to come.
🔥 Tesla’s Next Move? A Market-Defining Moment! 🔥
This isn’t just another stock movement—it’s a battle between fear and ambition, bulls and bears, excitement and caution. Tesla is standing on the edge of innovation and volatility, making its current price action one of the most thrilling showdowns in the market today.
Will it skyrocket toward greatness , or will the bears drag it down?
Whatever happens next, one thing is certain— this ride will be unforgettable . Buckle up! 🚀⚡🔥
Let me know if you want even more refinements or additional angles! 😎🔥
Subscribe for more!

TSLA BUYBUY TSLA at 272.00 to 248.00, riding it back up to 470.00 to 515.00 as Profit Targets, Stop Loss is at 213.00!
If anyone likes long mumbo jumbo garbage analysis, than this is NOT for you.
Also, if you are afraid of risk, failure, and want only a 100% sure thing, than
run as fast as you can from the markets, because it is definitely NOT for you.
WARNING: This is just my opinions of the market and its only for journaling purpose. This information and any publication here are NOT meant to be, and do NOT constitute, financial, investment, trading, or other types of advice or recommendations. Trading any market instrument is a RISKY business, so do your own due diligence, and trade at your own risk. You can loose all of your money and much more.

Tesla rejects bull flagTesla rejected the bull flag and immediately dropped back to the weekly demand zone. I am glad I only sold one TSLL put around the base of the flag rejection retest. I have taken this opportunity to buy 1000 shares for a big swing trade here. There was a very strong bounce on my rejection target of 275.
I believe we see 330 again in no time.
My plan: 1000 shares of TSLL
Old 13$ CSP sold
new 9$ CSP solds
13$ Covered calls sold for next week x10

TSLA Swing Trade Plan – 2025-06-06⚡ TSLA Swing Trade Plan – 2025-06-06
Bias: Moderately Bullish (short-term bounce to $305)
Timeframe: 5–7 days
Catalysts: Fundstrat upgrade, government contract news, max pain magnet
Trade Type: Naked call option
🧠 Model Summary Table
Model Bias Strategy Strike Premium Target(s) Stop-Loss Confidence
Grok Moderately Bearish $290 PUT $5.15 +25–50% gain –50% premium 78%
Claude Moderately Bullish $305 CALL $23.30 $28 / $32 $18.50 75%
Llama Moderately Bullish $305 CALL $23.40 $310 spot target $295 spot break 80%
Gemini Moderately Bearish $280 PUT (entry < $308) $3.30 $6.00 $1.65 70%
DeepSeek Moderately Bullish $305 CALL $23.20 $310 / $315 $291 spot break 75%
✅ Consensus: Bounce likely toward $305 on sentiment and positioning
⚠️ Disagreements: Direction split — bounce vs. breakdown continuation
🔍 Technical & Sentiment Summary
Trend: Below key EMAs, but short-term bounce forming
Support Zone: $291–297
Resistance / Magnet: $302–305 (max pain + liquidity)
Volatility: VIX ~17.6 — neutral, supports option buying
News: Gov’t contracts + Fundstrat upgrade — potential upside fuel
✅ Final Trade Setup
Parameter Value
Instrument TSLA
Strategy CALL (LONG)
Strike $305
Expiry 2025-06-20
Entry Price $23.30
Profit Target $28.00
Stop Loss $18.50
Size 1 contract
Entry Timing At open
Confidence 75%
💡 Rationale: Strong call wall + magnet effect at $305 with improving sentiment despite daily weakness — high-risk, short-duration swing setup.
⚠️ Key Risks & Considerations
Rejection at $297–300 zone could confirm further downside
Time decay will accelerate approaching midweek — exit quickly if thesis invalidates
Negative TSLA or macro news could reverse bounce fast
Limit size to protect portfolio: risk ≤3% of account

TSLATESLA following Fib Retracement (marked on Left) as well as Fib Extension (on Right) to the T.
News is incidental.
The BIG BEAUTIFUL FIGHT may even be fake.
But Fibonacci rules!

TESLA: Long Signal with Entry/SL/TP
TESLA
- Classic bullish formation
- Our team expects pullback
SUGGESTED TRADE:
Swing Trade
Long TESLA
Entry - 295.19
Sl - 276.74
Tp -325.39
Our Risk - 1%
Start protection of your profits from lower levels
Disclosure: I am part of Trade Nation's Influencer program and receive a monthly fee for using their TradingView charts in my analysis.
❤️ Please, support our work with like & comment! ❤️

TESLA Massive Short! SELL!
My dear friends,
Please, find my technical outlook for TESLA below:
The instrument tests an important psychological level 345.78
Bias - Bearish
Technical Indicators: Supper Trend gives a precise Bearish signal, while Pivot Point HL predicts price changes and potential reversals in the market.
Target - 308.21
Recommended Stop Loss - 364.73
About Used Indicators:
Super-trend indicator is more useful in trending markets where there are clear uptrends and downtrends in price.
Disclosure: I am part of Trade Nation's Influencer program and receive a monthly fee for using their TradingView charts in my analysis.
———————————
WISH YOU ALL LUCK

$NASDAQ:TSLA is Going to SkyRocket is Inevitable.NASDAQ:TSLA
Hi
Its the Moment for Collecting and Accumulating Stocks.
From Today on wards and upto 2 to 3 Years, its goin Sky Rocket.
Dnt Miss The Rallly ......
Thanks

TESLA TO THE MOON?!! OR TO 0??We are currently developing a bullish channel, we will likely retest the resistance of it at around 317-322 then head up to our FVG zone around 336-343. I am holding options for that very position. For long term stock holders, this is where things get interesting. Tesla is headed to the moon whether you like it or not. Probably the stock as well as the car, haha. So I am predicting at least 60000 per share in the long run. This may seem crazy to some but others will understand. AZO is the most consistent stock and has got 50000% of what it used to be. Tesla will be the next auto one but by far better. Tesla will get dominance in the global EV market. Their self driving cars will bring tremendous revenue, they have pretty much no competition either.
They don’t stop here though. Tesla isn’t just a car company. Their energy division (solar, batteries) will overtake traditional utilities.
Tesla is also trying to expand into robotics and AI at an unprecedented scale.
Hyperloop, Neuralink, and other Musk-affiliated companies also somehow contribute to Tesla's valuation which are all successful.
Now the recent “feud” with Trump and Elon may have some worried about Tesla. But as infouential as he is, he is only president for 4 years total. Elon has way more control and is here to stay. That feud means nothing long term, all it does is put Tesla on sale for a week or two. Buy now. Good luck traders. Do your own research please.

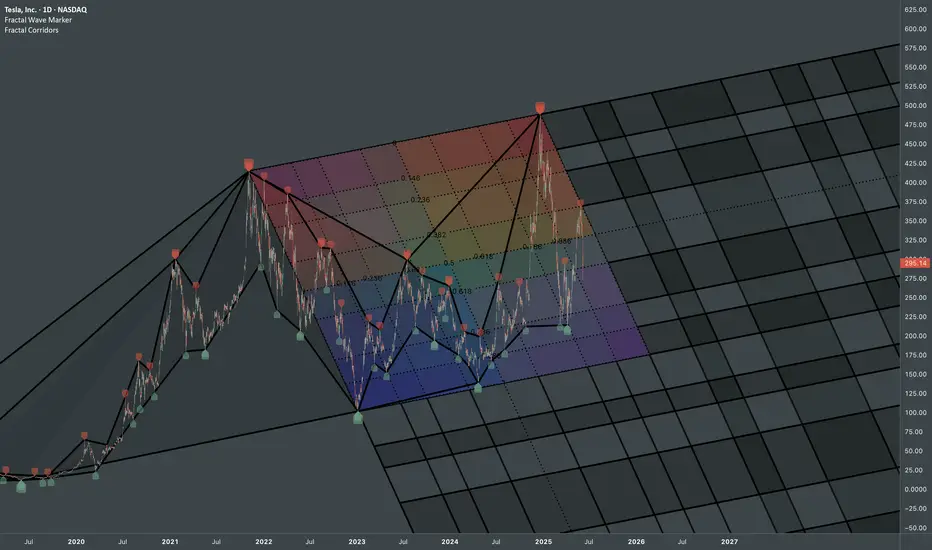
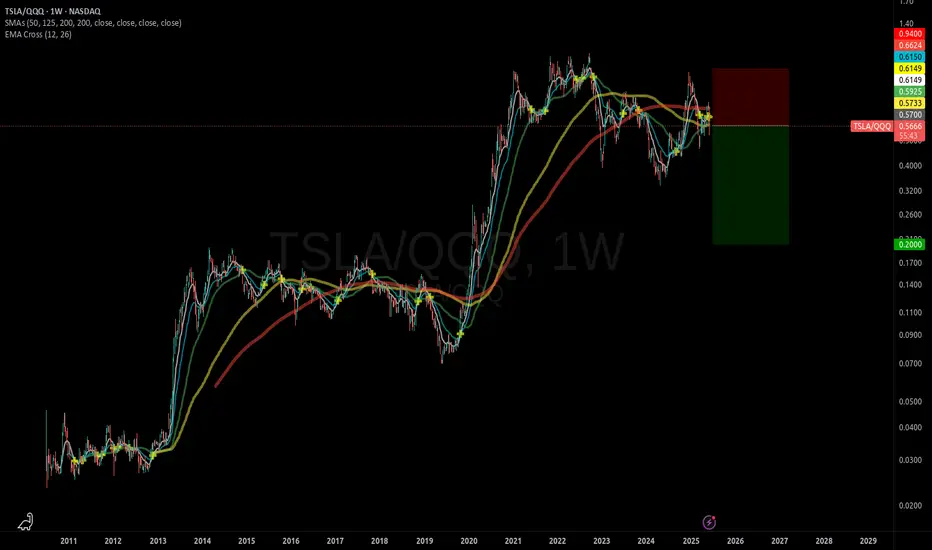
Tesla: Interconnected ATHsStructural update to:
Chronologically connecting pivots via fib channels creates a probabilistic map that captures the rhythm and scale relationships inherent in systematic price movements.
Fractal Wave Marker & Fractal Corridors were used to transform raw price data into a coherent, multiscale structure. Combo of those indicators makes you actually pay attention to ongoing patterns and get an idea how formations on smaller scale can be part of a bigger structural narrative.
Start of double bottom or bullish reversalPrice is nearing the trendline. If it crosses trendline, it will have to come back to test it before going further bullish. If it gets rejected at trendline, it could form a double bottom before testing the trendline again.

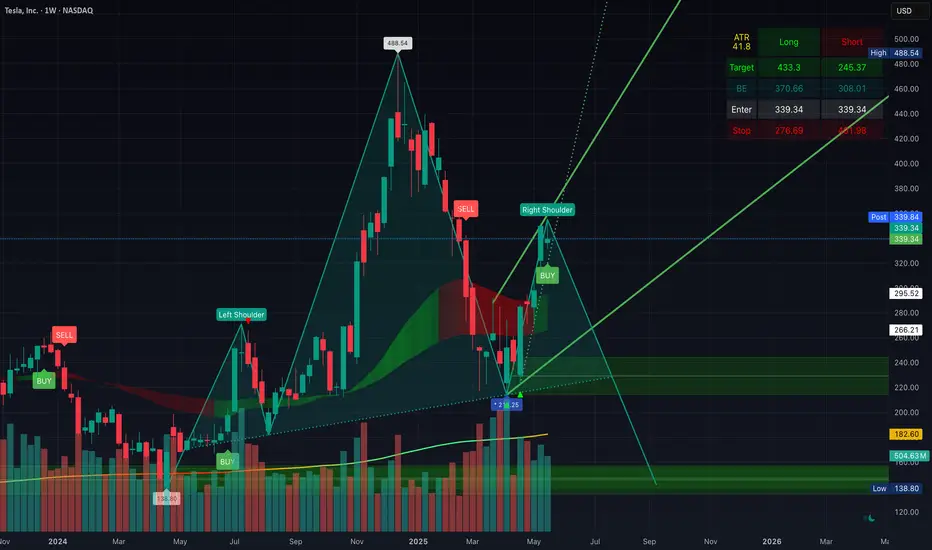
Potential Head & Shoulder Forming On The WeeklyPotential Head & Shoulder Forming On The Weekly... Facing still resistance at the $350 area, and should retest support at $280 within the coming days/weeks. If 280 breaks, should retest $240 (the h&s neckline) and could crash to $100 if that doesn't hold.
Time to take profit/hedge imo
TESLA RECOVERY AHEAD|LONG|
✅TESLA lost more than 25%
On the Elon VS Trump fallout
In less than a week which is
Seen by many as an excellent
Opportunity to add TESLA stocks
To their portfolios with a great
Discount which is why we are
Already seeing a nice rebound
From the wide strong horizontal
Support just above 270$ level
And as we are locally bullish
Biased we will be expecting
Further growth on Monday
LONG🚀
✅Like and subscribe to never miss a new idea!✅
Disclosure: I am part of Trade Nation's Influencer program and receive a monthly fee for using their TradingView charts in my analysis.

Short TSLA, Long QQQTSLA is expected to under-perform the QQQ ETF.
Whether it goes up or down in price, this trade will make money as long as the Nasdaq-100 index is stronger than TSLA.
VERY WIDE stop-loss is required.

$TSLA - Time to BUY (F to sellers)When weak hands sell in fear, we proudly buy.
Tesla is at the perfect spot for buying right now, both from fundamental and technical sides. The recent fight between Elon & Trump granted so much needed correction to the chart. The price is resting on the $260 - $280 support now - ideal spot for buying before the massive blast off will happen.
A few technical factors: there is a HUGE ascending triangle with horizontal resistance ($415), the 3rd approach of this resistance should be final before the breakout happens! Moreover, the price is steadily forming a bullish pennant that will help in breaking the resistance up.
The overall trend is strictly bullish according to Fibo. The target of this upward movement is located in the $900 - $1000 zone which is x4 from current points. Not very often in our century you get such an opportunity.
You may have different opinions about Elon Musk, but you can't deny the fact he is brilliant businessman and entrepreneur. You can already see that "Tesla owners are scrambling to remove their anti Elon stickers from their car now that he is feuding with Trump" . Elon is a good-guy for liberals again, while republicans didn't change their positive attire regarding his company as well.
I tend to believe that all those news we witnessed yesterday (mean Elon&Trump fight) was just a part of a bigger plan , the outcome of which we will see later this year or even next year.

$BULLISH STRATEGY - SIMPLE BUT OFTEN USEFUL !This simple Strategy says when a trend has been shaped already the Second time which price hits the channel would be the most powerful wave can break even a static level !
