$UBER: Why $UBER Is a Robotaxi WinnerUber is on the verge of a major transformation, with robotaxis set to become a game-changing profit engine.
Technical charts indicate we can enter a long position today with low risk, while aiming for a long term rally resumption from here. Monthly and quarterly timeframe Time@Mode trends are bull
Key facts today
Next report date
—
Report period
—
EPS estimate
—
Revenue estimate
—
5.40 EUR
9.52 B EUR
42.48 B EUR
2.01 B
About Uber Technologies, Inc.
Sector
Industry
CEO
Dara Khosrowshahi
Website
Headquarters
San Francisco
Founded
2009
FIGI
BBG00P498RW7
Uber Technologies, Inc. is a technology platform, which engages in the development and operation of technology applications, networks, and product to power movement from point A to point B. The firm offers ride services and merchants delivery service providers for meal preparation, grocery, and other delivery services. It operates through the following segments: Mobility, Delivery, and Freight. The Mobility segment refers to products that connect consumers with Mobility Drivers who provide rides in a variety of vehicles, such as cars, auto rickshaws, motorbikes, minibuses, or taxis. The Delivery segment offers consumers the chance to search for and discover local restaurants, order a meal, and either pick-up at the restaurant or have the meal delivered. The Freight segment focuses on connecting Carriers with Shippers on its platform, and gives Carriers upfront, transparent pricing, and the ability to book a shipment. The company was founded by Oscar Salazar Gaitan, Travis Kalanick, and Garrett Camp in 2009 and is headquartered in San Francisco, CA.

Uber: Upward Momentum ExpectedUber attempted to counter recent sell-offs with an upward move; however, downward pressure quickly resumed. We must still consider a 35% chance that the turquoise wave alt.3 has already concluded, which would imply direct declines below support at $77.57 during wave alt.4 . In this scenario, long

Is This the Perfect Moment to Execute the UBER Heist?💰 UBER Stock Market Heist Blueprint 🚀
🌟 Hi! Hola! Ola! Bonjour! Hallo! Marhaba! 🌟
Dear Money Makers & Robbers, 🤑💰💸✈️
Here’s our grand plan: a 🔥Thief Trading Style heist🔥 targeting the UBER stock! Let’s break in with this cunning strategy — chart-ready and primed for action!
🎯 Entry:
The vault’s o


Short Uber to deathUber driver's pay is declining constantly. This week it reached the point where good drivers are quitting. The self driving technology to replace these drivers is not yet here. Uber will start absorbing the self driving cars maintenance costs. They will be surprised how much money it takes to ha

#UBERUber shares will fall by at least 60% due to the blatant and flagrant infringement of Carma Technology's patents.

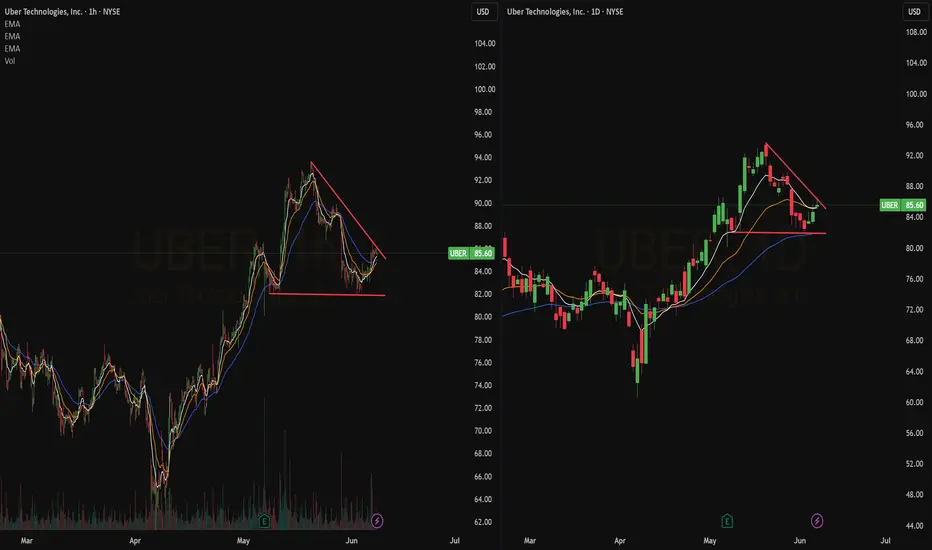
Quick View: $UBER- Bullish setup on the daily that sees a triangle with support found on the ema 50Daily.
- Classic pullback on the hourly
Area of $86-$87 as key resistance.
Support → $81
UBER results on quick flips for this ticker--Long @ 82.53 If I ranked the performance of UBER with my algo vs. all the other large caps I trade, it would rank right near the top with regard to return per day held. I don't rank it, because I don't have enough historical data to include it in my rankings.
Its limited results are impressive, however. 196

Uber Technologies (UBER) – Break & Retest + Long-Term GrowthOverview Summary
Uber Technologies Inc. ( NYSE:UBER ) has approached a structurally significant price zone, both from a technical and fundamental lens. After a strong rally into the $90s, price action has pulled back toward a multi-year resistance-turned-support zone between $81–84. This zone pr

Uber: Topped out Already?Uber sold off sharply after topping out at $94.10 – thus, our short-term alternative scenario needs to be considered. In this view (35% probability), turquoise wave alt.3 has already concluded, and the stock is headed toward a pullback in wave alt.4 . That retracement would likely bottom in the t

See all ideas
Summarizing what the indicators are suggesting.
Neutral
SellBuy
Strong sellStrong buy
Strong sellSellNeutralBuyStrong buy
Neutral
SellBuy
Strong sellStrong buy
Strong sellSellNeutralBuyStrong buy
Neutral
SellBuy
Strong sellStrong buy
Strong sellSellNeutralBuyStrong buy
An aggregate view of professional's ratings.
Neutral
SellBuy
Strong sellStrong buy
Strong sellSellNeutralBuyStrong buy
Neutral
SellBuy
Strong sellStrong buy
Strong sellSellNeutralBuyStrong buy
Neutral
SellBuy
Strong sellStrong buy
Strong sellSellNeutralBuyStrong buy
Displays a symbol's price movements over previous years to identify recurring trends.
UBRT4884099
Uber Technologies, Inc. 7.5% 15-SEP-2027Yield to maturity
6.61%
Maturity date
Sep 15, 2027
UBRT5886387
Uber Technologies, Inc. 5.35% 15-SEP-2054Yield to maturity
6.12%
Maturity date
Sep 15, 2054
USU9029YAF7
UBER TECHNO. 20/28 REGSYield to maturity
6.02%
Maturity date
Jan 15, 2028
UBRT5886385
Uber Technologies, Inc. 4.8% 15-SEP-2034Yield to maturity
5.25%
Maturity date
Sep 15, 2034
USU9029YAG5
UBER TECHNO. 21/29 REGSYield to maturity
4.94%
Maturity date
Aug 15, 2029
UBRT5886386
Uber Technologies, Inc. 4.3% 15-JAN-2030Yield to maturity
4.61%
Maturity date
Jan 15, 2030
UBRT6077245
Uber Technologies, Inc. 0.0% 15-MAY-2028Yield to maturity
−2.20%
Maturity date
May 15, 2028
UBRT5706997
Uber Technologies, Inc. 0.875% 01-DEC-2028Yield to maturity
−6.47%
Maturity date
Dec 1, 2028
UBRT5323752
Uber Technologies, Inc. 0.0% 15-DEC-2025Yield to maturity
−21.07%
Maturity date
Dec 15, 2025
See all UBER bonds
Curated watchlists where UBER is featured.


Related stocks
Frequently Asked Questions
The current price of UBER is 70.85 EUR — it has increased by 0.91% in the past 24 hours. Watch UBER TECHNOLOGIES INC stock price performance more closely on the chart.
Depending on the exchange, the stock ticker may vary. For instance, on VIE exchange UBER TECHNOLOGIES INC stocks are traded under the ticker UBER.
UBER stock has fallen by −1.23% compared to the previous week, the month change is a −7.18% fall, over the last year UBER TECHNOLOGIES INC has showed a 8.20% increase.
We've gathered analysts' opinions on UBER TECHNOLOGIES INC future price: according to them, UBER price has a max estimate of 99.62 EUR and a min estimate of 65.83 EUR. Watch UBER chart and read a more detailed UBER TECHNOLOGIES INC stock forecast: see what analysts think of UBER TECHNOLOGIES INC and suggest that you do with its stocks.
UBER reached its all-time high on May 20, 2025 with the price of 83.20 EUR, and its all-time low was 13.53 EUR and was reached on Mar 19, 2020. View more price dynamics on UBER chart.
See other stocks reaching their highest and lowest prices.
See other stocks reaching their highest and lowest prices.
UBER stock is 5.26% volatile and has beta coefficient of 1.20. Track UBER TECHNOLOGIES INC stock price on the chart and check out the list of the most volatile stocks — is UBER TECHNOLOGIES INC there?
Today UBER TECHNOLOGIES INC has the market capitalization of 151.97 B, it has decreased by −1.66% over the last week.
Yes, you can track UBER TECHNOLOGIES INC financials in yearly and quarterly reports right on TradingView.
UBER TECHNOLOGIES INC is going to release the next earnings report on Aug 5, 2025. Keep track of upcoming events with our Earnings Calendar.
UBER earnings for the last quarter are 0.77 EUR per share, whereas the estimation was 0.47 EUR resulting in a 63.53% surprise. The estimated earnings for the next quarter are 0.55 EUR per share. See more details about UBER TECHNOLOGIES INC earnings.
UBER TECHNOLOGIES INC revenue for the last quarter amounts to 10.66 B EUR, despite the estimated figure of 10.75 B EUR. In the next quarter, revenue is expected to reach 10.85 B EUR.
UBER net income for the last quarter is 1.64 B EUR, while the quarter before that showed 6.65 B EUR of net income which accounts for −75.31% change. Track more UBER TECHNOLOGIES INC financial stats to get the full picture.
No, UBER doesn't pay any dividends to its shareholders. But don't worry, we've prepared a list of high-dividend stocks for you.
As of Jun 19, 2025, the company has 31.1 K employees. See our rating of the largest employees — is UBER TECHNOLOGIES INC on this list?
EBITDA measures a company's operating performance, its growth signifies an improvement in the efficiency of a company. UBER TECHNOLOGIES INC EBITDA is 4.85 B EUR, and current EBITDA margin is 10.71%. See more stats in UBER TECHNOLOGIES INC financial statements.
Like other stocks, UBER shares are traded on stock exchanges, e.g. Nasdaq, Nyse, Euronext, and the easiest way to buy them is through an online stock broker. To do this, you need to open an account and follow a broker's procedures, then start trading. You can trade UBER TECHNOLOGIES INC stock right from TradingView charts — choose your broker and connect to your account.
Investing in stocks requires a comprehensive research: you should carefully study all the available data, e.g. company's financials, related news, and its technical analysis. So UBER TECHNOLOGIES INC technincal analysis shows the sell today, and its 1 week rating is buy. Since market conditions are prone to changes, it's worth looking a bit further into the future — according to the 1 month rating UBER TECHNOLOGIES INC stock shows the buy signal. See more of UBER TECHNOLOGIES INC technicals for a more comprehensive analysis.
If you're still not sure, try looking for inspiration in our curated watchlists.
If you're still not sure, try looking for inspiration in our curated watchlists.