UNH watch $288-297: Double Golden zone a serious Long Term Buy?UNH keeps getting bad news but may have bottomed.
Wave may have tested Double Golden fibs successfully.
Looking for some consolidation then launch of recovery.
$287.91-296.92 (Gold) is the key zone of interest.
$382.05-384.18 (Red) is the first long term target.
$251.94-255.83 (Green) is the MUST_HOLD bottom.
.
Previous Analysis that caught the top EXACTLY
Follow and Boost to encourage more such PRECISE charts.
==================================================
.
UNH trade ideas

$UNH the bounce continues higherI think it's likely that we continue higher from here. I could see us finding a short term top somewhere between the 3 resistances above.
Let's see how high we go.
$396 is the target I will likely taking profits.

UNH bullish trend to continueElliot waves take a break after an impulsive streak, that's what we can see here.
The stock held the critical $300-ish Fib level and now reversing, having left the oversold zone getting ready for its next upward stretch.
Holding $321 is the next challenge, but rest assured a company with 400 billion annual rev isn't going anywhere. The press smears won't stick either.
Enjoy the recovery ride!

Not All Hype = Opportunity | UnitedHealth $UNH Analysis
Lately, I’ve been seeing a lot of chatter about buying NYSE:UNH — UnitedHealth Group — as if it’s the “big opportunity” after the drop…
But let’s keep it real — the chart isn’t confirming that yet. 👀
Take a close look 👇
Price completely broke structure from previous highs around $630.
The recent drop was aggressive, and there's no clean retest or setup forming yet.
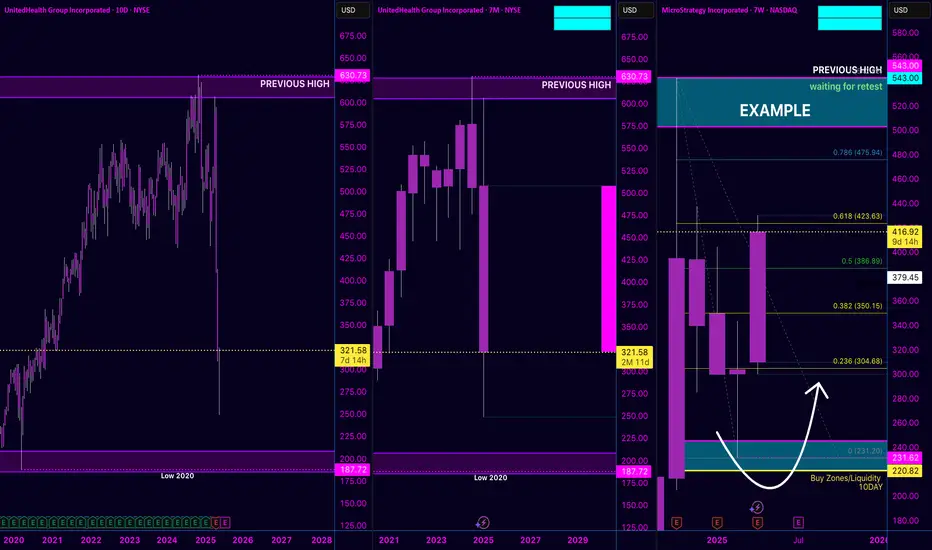
Unlike NASDAQ:MSTR (MicroStrategy), which gave us a structured pullback and liquidity sweep, NYSE:UNH still looks like it has more downside to go.
⚠️ I’m not rushing in because the news or a rumor says “buy now.”
I’d rather wait for a clearer structure, a lower low, and a reaction from a real demand zone — just like the example I marked on MicroStrategy.
This is a great reminder:
Let price tell you when it's time — not social media hype.
For now, NYSE:UNH goes on the watchlist, not the buy list. 📉🧠
Dont jump to buy United Healthcare - LongUnited healthcare a leading insurance provider with around 15% market share will be a good buy but wait for it drop more and settle around 280-240$ which was the previous resistance prior to covid. Wait and buy at those levels for long term portfolio.

Generational Buy - Congratulations Well done to those that bought the dip on this below $300. I filled 80% of my position at $250 - the Point of Control according to the highest volume node.
We had a capitulation in the top healthcare insurer. Absolute peak fear given the long list of events which culminated in the CEO leaving. His departure could have been the final flush out as holders capitulated.
This presented a unique opportunity to get in on an undervalued stock trading at a P/E of 11.1.
I’m a trader, so I won’t comment on the ethics of this company, it’s beyond the scope of my work.
Technically I expect this relief rally to continue but in a corrective fashion with a potential resistance level looming. The 5th wave ending is normally followed by an abc correction, wave A has concluded, wave B is in play so I expect onward bullish recovery. For confluence, the weekly RSI had a complete reset hitting level of 30, the most oversold in many years. My indicator has flashed green (buy) so $250 could have been a generational low.
None of this is financial advice, I got in at a good entry and I have a stop loss in place if this poops the bed again.

UnitedHealth long term predictionSee text on chart. It's based on RSI, financial statements, news and technical analysis of support and resistance.
The huge drop due to the CEO stepping down is an overreaction from the market. Go long to 400 for low risk and to 440 with medium risk. High risk is 500, which I don't think we'll get in a while.

IT WILL COLLAPSEIt will all collapse. UNH was down -25% and -18% on the day like a week ago. The thing will collapse and so will the american stock market.

UNH | Catching the Fall Risky Play💊 Oversold Swing Play
⚠️ Risk Factor
You're not trading a bounce—you’re stepping into a fire. Legal risk + uncertainty = extreme volatility. However, if markets stabilize, UNH could deliver a powerful mean-reversion move.
UnitedHealth ( NYSE:UNH ) is trading in panic territory after:
DOJ launched a criminal probe tied to Medicare Advantage billing
Abrupt CEO resignation
Suspended 2025 financial guidance, sparking investor selloff
Still, the fundamentals aren’t dead. Q1 revenue is strong, and long-term value is on the table.
🎯 Trade Plan
🟢 Entry Zones
🔹 Zone 1: $275–$285 → Technical support + RSI oversold
🔹 Zone 2: $255 → 2021 breakout retest
🔹 Zone 3: $225 → Ultimate fear zone (deep capitulation possible)
💰 Profit Targets
✅ TP1: $300 – Psychological level & minor resistance
✅ TP2: $340 – Gap-fill area & 50-day MA
✅ TP3: $385+ – Long-term value zone if sentiment reverses
📌 Final Word
UNH is no penny stock—it’s a $280B giant under siege. If you believe fear is overdone, this is a calculated shot at a rebound. Just keep your stops tight and your thesis tighter.
🚨 Disclaimer: This is not financial advice. Trading involves risk. Always DYOR and manage your exposure carefully.

Forget $342 more like $378This daily chart looks so primed to run hard all the way up to $378. It doesn’t get much better than this!!! The question is how soon will we smash through $342? If volume holds up, my guess is no later than May 23! This is only speculation and just for fun! Not financial advice so don’t go getting bent out of shape! 🙌

UnitedHealth (UNH) Share Price ReboundsUnitedHealth (UNH) Share Price Rebounds
A month ago, in our analysis of the UNH chart, we:
→ highlighted that UnitedHealth shares had lost nearly 23% in value;
→ drew a descending channel and suggested that bearish pressure could continue, threatening the support level around $450, which had held since early 2022.
Since then, UNH’s stock price decisively broke below that level (as marked by the arrow), falling to around $250 — its lowest point since spring 2020 — before staging a sharp rebound. This steep price movement was driven by a series of fundamental developments, including:
→ the resignation of the CEO and news of a Department of Justice investigation into potential Medicare fraud;
→ UnitedHealth withdrawing its earnings guidance for the coming year;
→ political debates over the Medicaid programme as part of the 2025 budget negotiations;
→ President Trump’s directive to cut prescription drug prices.
Recent news that the new CEO and several top executives have bought tens of millions of dollars’ worth of UNH shares appears to have renewed investor confidence — the share price rose above the $300 mark yesterday.
Technical Analysis of UNH Share Chart
These latest developments justify an update to the descending channel configuration. Of particular note is the gradual decline with limited volatility — a sign that the price is moving along the channel's median line (highlighted on the chart).
In this setup:
→ the bounce from the $250 level points to the lower boundary of the channel;
→ traders may consider a scenario where the current recovery pushes UnitedHealth stock towards the median, after which supply pressure may return and offset the recent dominance of demand.
It’s also possible that the key psychological level of $300 could now act as support.
This article represents the opinion of the Companies operating under the FXOpen brand only. It is not to be construed as an offer, solicitation, or recommendation with respect to products and services provided by the Companies operating under the FXOpen brand, nor is it to be considered financial advice.

Is $340 the next stop??Maybe we touch $342 as early as this week. It looks like it has the momentum to get there. All speculation so don’t get a bent out of shape. This is simply for fun. What are your thoughts??

UNH: Short OTM puts expiring May 23UNH bounced from the $248.88 low and will probably not hit new low the following week. IV was relative high due to volatile stock price movement. Hence, setting up naked shorts on OTM puts.
Max potential profits: $1,000+ premiums on May 23
Exit strategy: buy back gradually if UNH price crosses down $240 to secure positive results; otherwise, close all on May 23
Instrument Entry Date
UNH 23MAY25 200P 2025-05-15
UNH 23MAY25 210P 2025-05-16
UNH 23MAY25 225P 2025-05-16
========== STATS ==========
Number of traded instruments YTD: 20
P/L YTD: $2K
Win rate: 100%

$UNH: With stock down more than 60%, is it in buy zone? NYSE:UNH with one after bad news lost 60% of its market cap from its ATH of 600$. NYSE:UNH the largest insurer in US has been in news for all the wrong reasons. The stock after losing 60% of the value has a dividend yield of 3.1% which is 2.5 times of the S&P Yield. The historical dividend growth of NYSE:UNH has been more than 8%. This makes NYSE:UNH a compelling story stock during the recent downturn. With recent insider buys of the NYSE:UNH stock most of the fundamental indicators indicate a positive outlook.
But what are the technical indicators telling us? Today we are looking at the historical chart of the stock. The last time the stock was down more than 60% was during the 2007-2008 Financial recession. In 2008 it did lose more than 64%. If we investigate the long term RSI then we see it below 25 which we also saw last during the Financial recession.
Verdict : Buy 1/3 @ 250, Buy 1/3 @ 275, Buy 1/3 now.

UNH Reversal
After a brutal selloff, UNH printed a strong bullish candle today (+6.4%) 📈.
Looks like institutions might be stepping in.
🧭 Key Levels:
Support turned resistance: $284.88
Immediate Target: $350 🎯
Critical downside levels: $276.29 / $208.07
🕵️♂️ Watch for a retest and confirmation over $285.
Patience + Risk Management = 📊📈💰
#UNH #stocks #reversal #healthcare #bullishsetup

UNH can start DCA investment Strategy. 18 May 2025
UnitedHealth Group (UNH) – Oversold & Attracting Insider Confidence
UNH has recently drawn attention after its stock price dropped over 50% since mid-April 2025. Putting aside the fundamental and media noise, the technical analysis shows that the stock is heavily oversold.
Last Friday, the stock rebounded over 6%, possibly driven by a strong show of confidence from insiders. Newly reinstated CEO Stephen Hemsley purchased approximately $25 million worth of UNH shares (86,700 shares at an average of $288.18). CFO John Rex also acquired $5 million, with directors Timothy Flynn and Kristen Gil making significant purchases as well.
From a price action standpoint, the current level appears attractive for a Dollar-Cost Averaging (DCA) approach. However, I'm personally eyeing a potential deeper discount entry zone between $200–$220, which would offer an even more compelling long-term risk-reward setup.
Strategy: Start small with DCA at current levels, but be patient for deeper dips for larger entries.

This will not be a V-Shape recoverySignificant headwinds await UNH. From an institutional investment perspective, these are not the market conditions when you pile on risk holding onto this stock. Firms will de-risk and UNH clearly has been chopped!! Be cautions…UNH will be highly volatile and is extremely risky!!

How low can we go?$300-310 is looking very likely. Refer to my previous trade idea where I said mid $300s is my initial buy target. I am in as of $338, it’s increasingly looking like we will hit the lower levels where I intend to load up more.
Be careful catching this falling knife

UNH is a Great Opportunity Following Panic Sell-Off UNH remains a solid business with a great potential upside. The recent drop was driven by softer financials, CEO resignation, and a DOJ probe—more fear than fundamentals.
Core operations are stable. Valuation is now attractive, making this a solid entry point for patient investors.
Many argue that UNH is just an insurance business, not a tech company. They are wrong. UNH holds a massive amount of healthcare data that can be leveraged for insights, efficiency, and innovation. This data is not just an asset—it is a moat that few competitors can replicate.
The recent insider buying is a green flag ! a signal for investors that there are no skelatons in the closet
On the chart, increasing green volume supports bullish sentiment. The 10-day EMA has crossed above the 20-day EMA on the hourly timeframe, indicating short-term upward momentum. Additionally, the MACD is turning positive indicating less fear and more greed!, and RSI is trending higher—both pointing to strengthening buying pressure.

UnitedHealth Group Stock Chart Fibonacci Analysis 051625Trading Idea
1) Find a FIBO slingshot
2) Check FIBO 61.80% level
3) Entry Point > 287/61.80%
Chart time frame: D
A) 15 min(1W-3M)
B) 1 hr(3M-6M)
C) 4 hr(6M-1year)
D) 1 day(1-3years)
Stock progress: A
A) Keep rising over 61.80% resistance
B) 61.80% resistance
C) 61.80% support
D) Hit the bottom
E) Hit the top
Stocks rise as they rise from support and fall from resistance. Our goal is to find a low support point and enter. It can be referred to as buying at the pullback point. The pullback point can be found with a Fibonacci extension of 61.80%. This is a step to find entry level. 1) Find a triangle (Fibonacci Speed Fan Line) that connects the high (resistance) and low (support) points of the stock in progress, where it is continuously expressed as a Slingshot, 2) and create a Fibonacci extension level for the first rising wave from the start point of slingshot pattern.
When the current price goes over 61.80% level , that can be a good entry point, especially if the SMA 100 and 200 curves are gathered together at 61.80%, it is a very good entry point.
As a great help, tradingview provides these Fibonacci speed fan lines and extension levels with ease. So if you use the Fibonacci fan line, the extension level, and the SMA 100/200 curve well, you can find an entry point for the stock market. At least you have to enter at this low point to avoid trading failure, and if you are skilled at entering this low point, with fibonacci6180 technique, your reading skill to chart will be greatly improved.
If you want to do day trading, please set the time frame to 5 minutes or 15 minutes, and you will see many of the low point of rising stocks.
If want to prefer long term range trading, you can set the time frame to 1 hr or 1 day.

UNH can retrace the fib and come back to the lowSee trading is all about risk and probability.
There is news flowing left and right about insiders buying UNH for the dip, a director bought about $1m single handedly.
But remember, DOJ is serious about the Medicare Fraud Probe.
I believe since there is a huge, huge downfall from April 16, 2025... there will definitely be a retracement, but not till .5 or .618, imo.
So after retracement to 381 range, it may again fall down to 250 low ( as rapid downfall, suggests retracement to only 0.38 range, from my personal experience).
Huge Volume spike is also seen stating a lot of people are being involved in this stock. Some may try to get rid off it as soon as possible, some might speculate the comeback of UNH to 594 normal range.

Life Time Opportunity Trade Setup NYSE:UNH
Entry Price: $280 (at market open)
Profit Target: $400
Stop Loss: $250
Risk-Reward Ratio: 4.3:1
Position Size: 1% of portfolio
Why Bullish?
UNH is trading near a 5-year low ($248.88) after a -50% drop in a month, driven by a DOJ Medicare fraud probe and CEO change. Despite the noise, analysts are bullish with 55 Buy ratings and a $445-$460 target, pointing to undervaluation (forward P/E ~10x). Institutional buying (Viking Global +12.5% stake) and a low VIX (17.83) support a potential rebound.
Key Catalysts
Technicals: Near 52-week low, RSI oversold, potential reversal.
Fundamentals: $400B revenue, 15% EPS growth projected long-term.
News: DOJ probe and suspended 2025 guidance weigh, but analysts see overreaction.
Macro: VIX at 17.83 (stable), 10-year yields at 4.424% (headwind).
Risks
Ongoing DOJ investigation could escalate.
Rising medical costs and volatile sentiment.
Further downside if support at $250 breaks.
Chart Notes
UNH testing major support at $250-$270.
Volume spikes on selling, but capitulation may signal a bottom.
Watch for a break above $300 to confirm bullish momentum.
Keep your long term vision
Follow for the Best AI generated Signals on the market
Ash.

UnitedHealth Group | UNH | Long at $323.00UnitedHealth Group NYSE:UNH currently has a P/E near 15x, steady rising revenue (2024 = $400+ billion), EPS of 6.24x, dividend of 2.2%, and earnings are forecast to grow by 10.8% per year. The stock, however, has plummeted recently due to negative news, rising healthcare costs, CEO changes, and suspension of 2025 outlook. Every company has bumps, but I view solid companies like NYSE:UNH as pure opportunities for long-term investment - especially with America's aging population.
From a technical analysis perspective, the stock price has entered my "crash" simple moving average zone (which currently extends down near $307.00). Personally, this is the zone I am starting a position due to the odds of a future bounce from here. However, I am very aware that there is an open price gap near $265.00 that may get filled this year or early next. I could see a bounce in my crash zone to bring in the bulls and then a drop to that level to heighten the fear. That is another area I plan to grab more shares and build a strong position. But, in case it doesn't extend that low, I have started a position at $223.00, with future investments near $307.00 and below. I doubt this will be a quick turnaround stock - patience is where money is made.
Targets (into 2028):
$375.00
$475.00
$580.00
