UPS, INC - BEARISH SCENARIOHeadquartered in Atlanta, Georgia, United Parcel Service, Inc. is a package delivery, transportation, logistics, and related services, provider.
It is the largest package-delivery company, operating globally.
The company and its share price had benefited from pandemic-related spikes in demand, but
due to the normalized environment and a decline in volume in its US domestic business Q3`s results were unsatisfying.
The expectations are for a re-test of the resistance and a new low located at the $ 150 level
Risk Disclosure: Trading Foreign Exchange (Forex) and Contracts of Difference (CFD's) carries a high level of risk. By registering and signing up, any client affirms their understanding of their own personal accountability for all transactions performed within their account and recognizes the risks associated with trading on such markets and on such sites. Furthermore, one understands that the company carries zero influence over transactions, markets, and trading signals, therefore, cannot be held liable nor guarantee any profits or losses.
UPSI trade ideas

#UPS long idea to 215$Hello dear Traders,
Here is my idea for #UPS
Price closed above yellow line (previous month high)
Price closed (15min Chart) above purple trigger line to enter trade.
Targets marked in the chart (black lines)
Invalidation level marked with red line
Good luck!
❤️Please feel free to ask any question in comments. I will try to answer all! Thank you.
Please, support my work with like, thank you!❤️

UPS Call OptionUPS CALL OPTION
Looking for a call option at 175.00
There was a lot of order flow last Friday plus volume.
Wait for confirmation on the 5 min.

UPS Inc Fibonacci Channels Fibonacci spread over mid-term period.
Triple Cross UO arguments adjusted to the stock 1D TF

UPS down it goes - trade setupUPS downtrend most likely will continue, especially after the resistance has been defended multiple times.

UPS end of correctionUPS end of correction that might be it and we are starting wave 5 if going higher.

UPS daily bearish engulfing hammers wave 5 of wave COrder SELL UPS NYSE Stop 165.76 LMT 165.76 will be automatically canceled at 20230401 01:00:00 EST
UPS daily bearish engulfing hammers wave 5 of wave C take profit to MA 200 weekly and that's may be it for UPS correction.

$UPS with a Bullish outlook following its earnings #Stocks The PEAD projected a Bullish outlook for $UPS after a Positive over reaction following its earnings release placing the stock in drift B with an expected accuracy of 75%.

$UPS ER Range - BearishFuel costs and the expected lowered spending of the public for UPS's busy season I think will bring a drop on UPS.

UPS United Parcel Service Options Ahead of EarningsMy recent experience with those global package delivery companies was extremely painful. The have raised their prices a lot, on some occasions you pay the same price to send something to another country than taking the trip yourself and deliver that package in person.
So i have tried to avoid UPS, like many of you, and go for smaller unknown companies. I think this attitude will reflect in the upcoming earnings.
Looking at the UPS United Parcel Services options chain, i would buy the $160 strike price Puts with
2022-11-4 expiration date for about
$4.85 premium.
Looking forward to read your opinion about it.


UPS up for another drop.I just love these stocks that make an obvious hint for a drop in an otherwise bearish market. Going with the flow is always easier in general trend. Imagine swimming in a river and going against the current. Same with the market. Putting a long in this current general environment is extra risky.
We are not in the business of getting every prediction right, no one ever does and that is not the aim of the game. The Fibonacci targets are highlighted in purple with invalidation in red. Confirmation level, where relevant, is a pink dotted, finite line. Fibonacci goals, it is prudent to suggest, are nothing more than mere fractally evident and therefore statistically likely levels that the market will go to. Having said that, the market will always do what it wants and always has a mind of its own. Therefore, none of this is financial advice, so do your own research and rely only on your own analysis. Trading is a true one man sport. Good luck out there and stay safe.

UPS Bullish Bat & Complimentary DiamondSo recently over the course of many months. I have been following a different asset called Mercado Libre, and over there we are going through the maturity process of the whole Bullish Bat hormonic and... while eye balling this I saw potential for one to form. Keep in mind the "Grey" triangle to the right is simply a basic "Guide" of maybe more or less the prices action could go through for this to occur. We have on the weekly a Diamond that popped but soon formed another one, which is more of a Kite. I'm not saying it is in everyone's best interest for this to go down, "Unless you can short it somehow." Regardless if it goes up it will be a great continuation diamond. But if it down go down You may have basically a Year worth's of sell offs coming your way. -The bullish bat is more of a Ghost idea but the Diamond is definitely there maturing again to make a decision. I have set some transparent rectangles to show where initial price action could reach. What does not help a bullish case as well is the current state of the TTM Squeeze indicator. The histogram is like a Giant Green Rainbow finally coming to the Horizontal Middle line so watch out when putting buying positions.

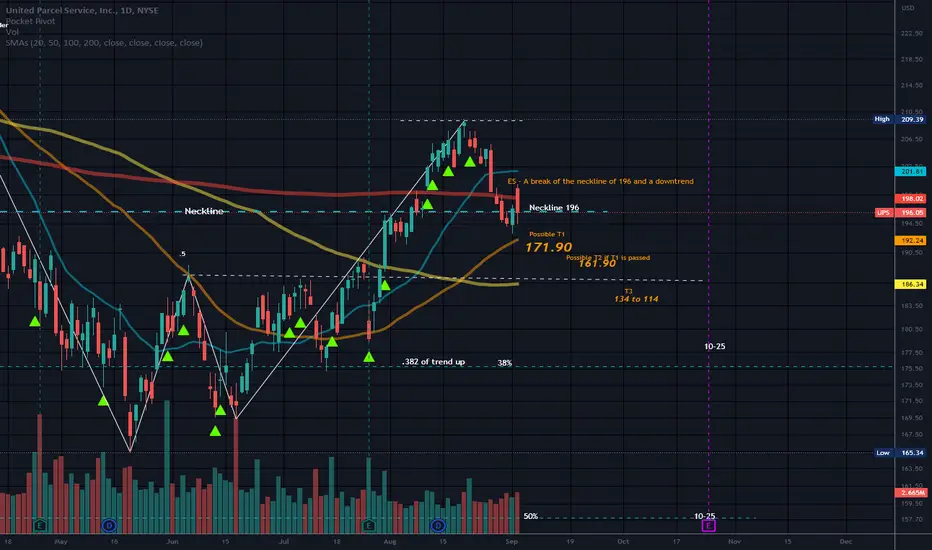
Head and ShouldersNeutral until Neckline is broken.
Price is hanging on the neckline of the prior Head & Shoulders pattern. Price slid under the neckline in the last few trading days but is hanging on for now.
This last run to the upside did not come close to the right shoulder.
This can be an ominous signal but not always.
If price breaks the neckline, the hump in the crooked W can be a source of support.
Short entry (ES) would be a break of that neckline which was violated today but there is no confirmed downtrend in place.
A confirmed downtrend can differ in definition from one person to the next.
Some use a 2 candle close, others would use a few more as throwbacks are common (throwback - price breaks the pattern threshold but quickly falls back in to the structure).
The neckline is a strong source of support until it is broken.
The neckline marks the pull back level of the 2 shoulders being the level that price reversed at on more than one occasion.
Retests of the neckline are common.
A neckline can slope.
Price is above the .382 of the trend up right now. If viewed on a weekly or monthly timeframe, it is an extremely steep impulse wave up.
Price did break the resistance of the neckline on it's last leg up but is teetering at that same level once again.
Suspicious W.
No recommendation except be safe.
The market can throw bullets that causes the maximum amount of pain to the maximum amount of people );
UPS Post Earnings PullbackNYSE:UPS Triggered a spike alert this morning which is happening at the 50% Retracement of the Post Earnings Rally. (see below for Daily higher timeframe context)
These are the real "earnings plays" that can yield positive returns rather than trying to buy a guess on the day before. Trying to buy or sell the day before earnings is a guess but very often earnings cycles create these setups weeks after a move has occurred with a much higher probability than a 50/50 bet.

UPS strong buyEntry: 199.5 (after touch 197.5)
TP1: 204.3 +2.4%
TP2: 213.3 +6.9%
SL: 193 -3.3%
Period length: 18-20 days


Ascending triangle on United Parcel Service. UPSWe have completed a very harmonious, symmetrical ascending triangle on UPS. And as we know a weak impulse or a corrective pattern always follows a triangle.
We are not in the business of getting every prediction right, no one ever does and that is not the aim of the game. The Fibonacci targets are highlighted in purple with invalidation in red. Confirmation level, where relevant, is a pink dotted, finite line. Fibonacci goals, it is prudent to suggest, are nothing more than mere fractally evident and therefore statistically likely levels that the market will go to. Having said that, the market will always do what it wants and always has a mind of its own. Therefore, none of this is financial advice, so do your own research and rely only on your own analysis. Trading is a true one man sport. Good luck out there and stay safe.

$UPS with a Bullish outlook following its earnings #Stocks The PEAD projected a Bullish outlook for $UPS after a Negative over reaction following its earnings release placing the stock in drift C.

UPS - Blue Chip, 3 month base breakoutBreaking out from a 3 month base. Buy the breakout now with a pilot position or wait for a minor technical pullback.
You don't need to know what's going to happen next to make money ~Mark Douglas
Lose like a pro and keep trading, or lose like a novice and quit ~Mark Ritchie

Breakout of right angled triangle the price broke the right angled triangle and possible heading to (TP1=193.75$/TP2=203.55)

UPS Long IdeaObviously overall market conditions will have a part to play in this trade. Relative Strength Index showing divergence on the daily indicating that a bullish reversal may be coming. Horizontal weekly support and channel support there to help the situation. MACD showing signs that it could turn positive soon, definitely one to watch. Will be looking for an entry on counter trend line break with target at top of channel.
