Walmart Inc. Accurate AnalysisThis stock is recovering from its shorts and we may see a bull back for a more bullish race. The pull back will confirm the buy for me. Buying now may be risky. As the pattern develops i will keep this idea updated, so like, comment, follow so you don't miss any update. Thank you.
WMT trade ideas

WMT - Descending ChannelWalmart is currently in a descending channel. Watch for a possible breakout from the channel.
The Elliot waves are just me messing around with the chart.


WMT - February 6, 2021Looking for WMT to breakout of this downtrend here. Earnings coming up in the next few weeks can help push this higher if money flows back into retail.


Short & quickThis trade is purely technical for me.
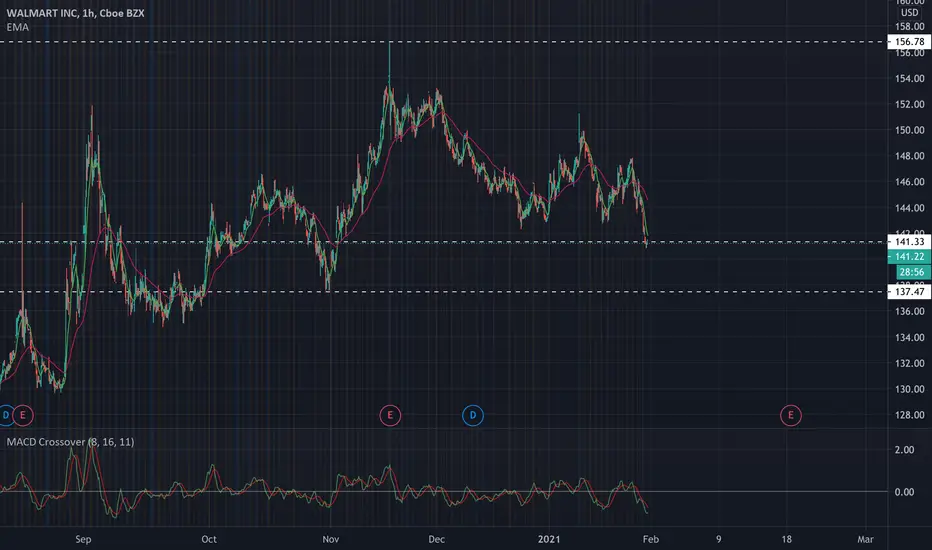
Technical signal
1) WMT seems to have entered a topping phase (hitting a 52 week high Nov-Dec 2020)
2) It broke a trend line (bearish)
3) Moving average crossed below (bearish)
I do not see a lot of momentum to the downside so I am - targeting $140 (a quick 3.5% move)

WMT before earnings rally?Good opportunity to ride the wave before feb 18th. Stop loss 134. Good luck!

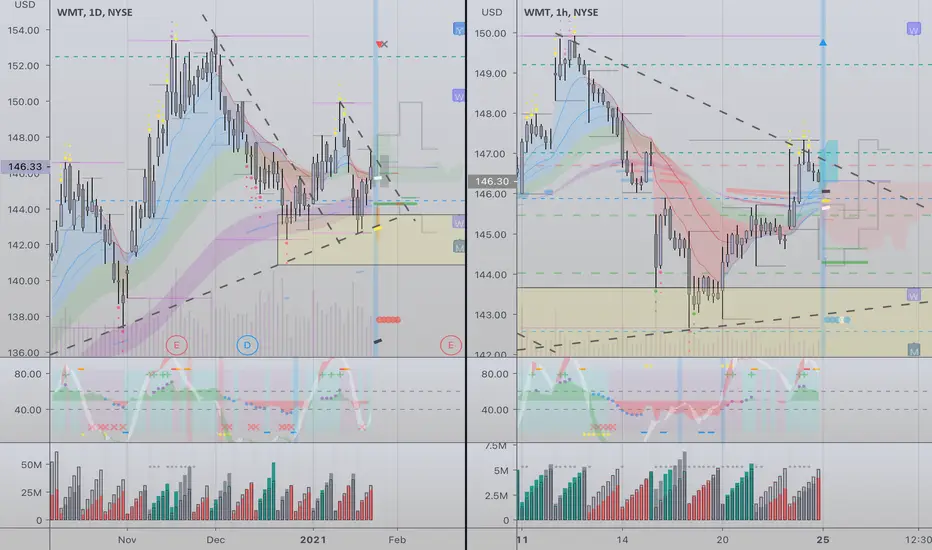
WMT approaching the 150 dayGetting close to testing the 150day. If that breaks I'd expect the 200day to be next. Not seeing any signs of the downtrend weakening.

Head and ShouldersHead and shoulder tops are not as accurate in a Bull market than in a bear market. H&S tops perform best in a bear market and inverse H&S bottoms perform better in a bull market.
LS 146.6 Head 153.66 RS 149.93
It is hard to slow down the momentum of the trend in a bull market so this pattern has a higher failure rate. Feels like the trend is slowing down a bit as of late though.
A strong trend is like a big steam boat and can not stop and turn around on a dime. But steam ships eventually stop and turn around.
Pattern becomes valid when price breaks the neckline in a downtrend..H&S tops are a reversal pattern and there must be an uptrend preceding it so it has something to reverse (o: It is a 3 peak pattern with the head being the tallest peak. The left and right shoulder do not have to have exactly the same price, but they should be in the same ball park.
I like to draw a line from the head to the neckline, use the magnet and move it under the neckline. This gives me an idea on how far it might fall..
If the three peaks are level, it is a triple top (LHCG) In a triple top pattern, the middle top may even be lower than the other two tops. (I have noticed quite a few of these as of late) This is what I like writing and posting these because reading about triple tops made me recall something I forgot about the middle peak being lower. The higher the velocity of the wave leading into this pattern, usually indicates a larger decline. (Think supply and demand) Downward volume trends also can also increase the move down. Also, if peak 3 is lower than the middle peak, often this will increase the decline. Pull ups (rallies up) can hurt performance
By no means a recommendation..
This is a strong stock so not telling. Maybe WMT just needs a hair cut (:
The trend is your friend until it is not..and it is not always a good idea to buy red (o:

TOP 5 STOCKS TO WATCH NEXT WEEK! $SHOP, $KO, $AMD, $WMT 1/30/21NASDAQ:AMD NYSE:SHOP NYSE:KO NYSE:V NYSE:WMT


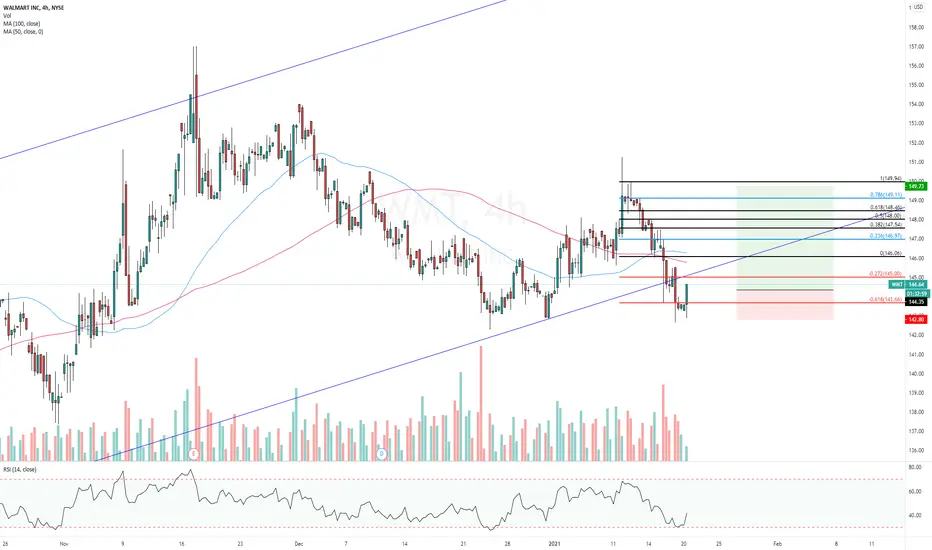
WMT 21-01-2021 LongAsset and Time frame -WMT,4H
Entry Price -144.39
Exit(Stop Loss) -142.72
Exit(Take Profit) -149.74
Technical Analysis -Price went outside of the daily confirmed trend line just to hit the 100 MA, I believe the 4H candle will close strong, and we will be back at the bullish channel, plus we have an outside bullish candle forming on the -61.8 confirmed Fibo
I would like to hear your opinions and what can I do to improve, many thanks
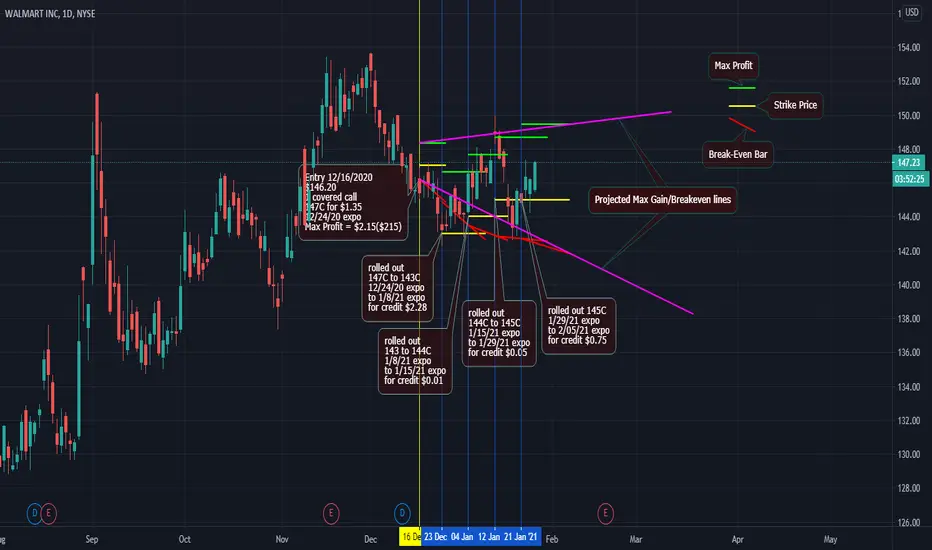
WMT Covered CallBeen holding this trade for a few weeks now. This is my first post related to options trading. I'm using the lines to show a visual of how selling a Call has helped create a range of profitability and risk management.
GREEN LINE - Max Profit - This green line is in relation to the original share price entry point, the Call strike price, plus any premium collected.
YELLOW LINE - Strike Price - I will adjust this often in an effort to continue to manage the risk, while maximizing profits. I try to stay under the stock price to maximize risk management.
RED LINE - Break-Even - This line is a proposed break-even price of the covered call. It is a linear sloped line, but is not accurate. This line give a rough estimation of what my break if is based on each expiration date.
PINK LINES - rough projections based on the last Max Profit and Break-Even potential. I'm using this to show what might potentially happen to the range, the longer I hold on to this trade.

WMT - Bearish MomentumIt seems people are back to buying the niche retailers as opposed to the big box retailers like WMT. I think it can fall to the 200ma.

Wmt looks good but the overall market is running high... If no natural calamities for market then i think it time for bounce back.


wmr walmart trading idea based on supply n demand wmr walmart trading ideas supply n demand trading ideas

