great longterm holdbut its not something we are looking at for calls. you want to be careful here with calls here because time decay. shares are a great option though. target 200 in the next 2 years :) gl!
WMT trade ideas

WMT huge insider sales Dec.1 2020 SO........ I always pay attn to when HUGE amounts of money leave or enter a stock. While looking for my next move I saw 200m in insider sales from the director and a 10% owner.
Now to me this is ALOT of money. And im thinking bout jan 15 $150 puts as you can see the averages are going down and I just dont see it hanging out where it is especially if there's others like me that see these kinds of sales and look for a reason why. BUT Disney pulled the exact same stunt before their last earnings and then it went up which differently caught me off guard. So maybe wait a day for lil more confirmation from the chart. Im looking to put in an order to buy one at open price and then will either buy more or get out depending on what chart tells me. attached link has the insider action in detail


Wmt dec pt 160broke out of my bull pendant perfectly. looking to see how this one plays out with a pt of 160

WMT - Possible long opportunity if price action confirmPossible long opportunity if price action confirm

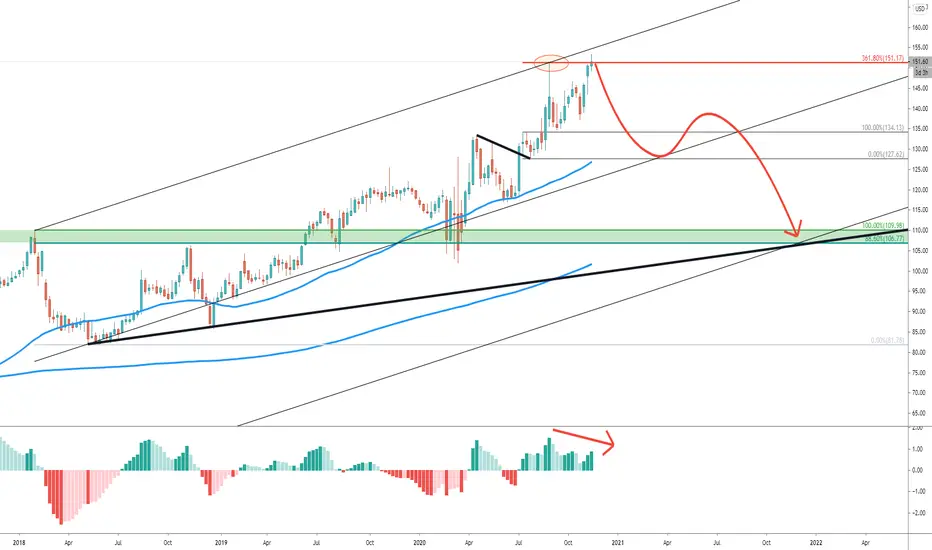
Walmart looks strongSo, the trend is long. The opportunity is given for a new high top, somewhere over 160 USD.
But if the price starts drop down, you can buy near 130-140 USD.
If you like my analysis, follow me:)


IRON TARIHi guys,
according to my strategy we have 4weeks 12% strikes, 90% probability of success.
For this Iron condor with 5$ spread for each side there is a max profit of 40$ and a max loss 460$: if you are new in Iron condor you should find this R/R ratio very poor compared with forex, but we have very high odds at our side! 90% to get the maxim profit, plus 5$ extra on both sides (the long legs) before to get tha max loss. If the weekly candle closes over the short strike we close the trade, for a loss lower than max loss of 460$.
If you are more experienced you'd love to jump in this trade as I do, Strangle, no long legs, for a max credit of 80$.
Enjoy your wallet!
Tari.


WMT Cup and HandleThere is a cup and handle on the weekly along with growing revenue and earnings. Might be a little late to the party, but at least there is confirmation now.

May go down to the middle of Bollinger Bands before bouncing.May go down to the middle of Bollinger Bands before bouncing for a longer-term bullish trend that started when it announced Walmart+

WMT Patient Play- Bullish on 618fib > 786fib. WMT
Today's Date: 11/18/20 3:30pm
TLDR: Wait to 0.618 fib/$135.25, hold to 0.786 fib/145.50$.
Channel doesn't seem to be holding as WMT can't break above 150$. 0.786 fib has been recent resistance and 0.618 fib a repetitive support. Play the fibs over the channel. This one will take patience, may not be a play until December as WMT doesn't move too fast.

$WMT with a bullish outlook after earningsAfter a negative over reaction following $WMT earnings, the PEAD projected a bullish outlook placing the stock in Drift C
If you would like to see the Drift for another stock please message us. Also click on the Like Button if this was useful and follow us or join us.

WMT To Break Through SupportWMT is set to break through support as shown on the Kurutoga cloud, once broken through Walmart will continue the bear trend. I plan to put $1k into this and go for a 1 month put. $140 by 12/4 this is possibly one of 5 positions I will be making tomorrow.

Hit a top, get ready for a short entryEarnings came out, lots of positive news on the e-comm side of things but WMT didn't take off on the upside.
From what I see, this is not a good sign plus the stock price needs to take some healthy profit taking.
Taking on a short position using Dec 18 Puts

WMT price movement day after earningsHot Potato Trader here, what is up fellow trader!
Earnings range based on historical data and option priced move.
WMT is going to report earnings on November 17, 2020 before market open on TUESDAY .
The options market overestimated WMT stocks earnings move 67 % of the time in the last # 12 quarters.
Key Points :
- A single earnings report can bring volatility , volume , and interest to an asset.
- Options market overestimated WMT stocks earnings move 67% of the time in the last 12 quarters.
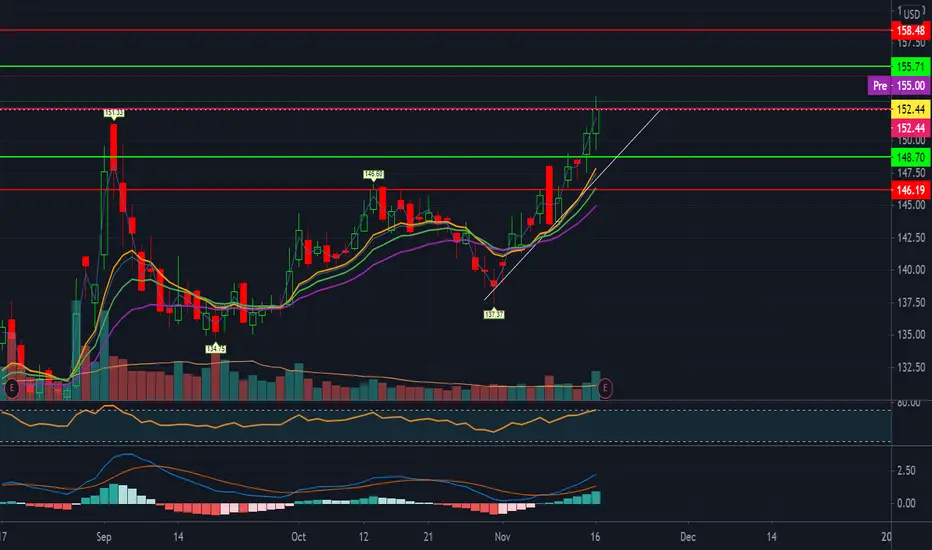
KEY LEVELS :
Previous day close price: S152.44
VWAP: 152.21
Expected Move: 4.1% ($6.25)
This Move: 2.3% ($3.50)
Expected Move: $6.25
low: $146.19
high: $158.46
This Move: $3.50
low: $148.70
high: $155.71
WMT is expected to stay within price range $146.19 and $158.46 with a confidence level of 6.7 /10
Note: A potential catalyst such as recent news could take WMT outside the range.
In this event, the catalyst would be considered significant. And identified as an outlier will be identified as bullish or bearish .
A 4.6% move on earnings will be considered.
The stock has averaged a 2.0% move in recent quarters.
Thanks for reviewing my idea and constructive criticism is welcome.
A clear pattern: Walmart earnings call warns short.After every Walmart earnings call from the past 5 years has a decline of on average $5 that occurs within a week after earnings call. My method is as follows: A day before I bought a put option on Walmart which expires in 12 days. I will hold this put option for a maximum of one week and wait until WMT stock falls to about $145-$148 per share.


$WMT looks bullishLooks extremely bullish - definitely watching this stock. Will buy at pullback @ $147 near the Blue line (Tenkan Sen)
(1) Price above Kumo
(2) Future Kumo bullish
(3) Senkou span A & B with positive slope
(4) Both Tenkan Sen & Kijun Sen have +ve slopes
(5) Chikou Span above the price & free to go up
(6) ADX > 25
