ZOOM- Bull Flag! 🐂After rising tremendous rates during the pandemic, Zoom got into a Cool-Down period.
Now that the bull flag was completed it is set again for a good rise!
Fundamentals:
Income statement: 2018-2019 --> +298.43% increase
2019-2020 --> +233.66% increase
Cash Flow: 2018 -2019 --> +164.24% increase
2019-2020 --> +195.90% increase
Big investors are keeping a HOLD opinion on this boy, while the street seems to catch-up on the Bull Flag.
Entry Point: In the short/Mid-term with the currently completed bull-flag we are keeping a BUY on Zoom. Long-term definitely a buy as well.
Also, the earnings are coming up next month on 03/01/2021 which will add some volume to the stock as well!
ZOOM trade ideas

Are the Bulls Logging Off Zoom Video?Zoom Video Communications has staggered since last year’s massive rally. Now it’s making a lower high and may be at risk of further downside.
Notice how ZM attempted to rebound above $450 this week but was quickly rejected. That’s important because it matches the high-volume bearish gap from November 9 – the same day positive vaccine news changed the narrative on coronavirus.
Second, the current price zone is near the 100-day simple moving average (SMA). That line recently turned negative as well, suggesting the longer-term momentum has turned bearish. (See our MA speed script, featured in this chart.)
Third, stochastics are retreating from an oversold condition.
It’s interesting that ZM reported super-strong results on November 30 but still crashed. Will that precedent repeat with the next set of numbers due on March 1?
ZM trades for more than 60x revenue and about 290x earnings. That makes a famously rich stock like Salesforce.com (11x and 64x) look cheap.
Valuations could be important now as interest rates shoot higher and investors rotate back to lower-multiple financials and industrials. Covid cases are also down about 75 percent in the last month. The new backdrop may prove increasingly difficult for ZM.
TradeStation is a pioneer in the trading industry, providing access to stocks, options, futures and cryptocurrencies. See our Overview for more.

ZM, RSI Indicator left the overbought zone on February 17, 2021This is a signal that ZM's price could be shifting from an uptrend to a downtrend. Traders may consider selling the stock or exploring put options. A.I.dvisor looked back and found 21 similar cases where ZM's RSI Indicator left the overbought zone, and in 16 of them led to a successful outcome. Odds of Success: 76%. Current price $416.37 crossed the support line at $438.73 and is trading between $438.73 support and $413.13 resistance lines. Throughout the month of 01/14/21 - 02/17/21, the price experienced a +12% Uptrend, while the week of 02/09/21 - 02/17/21 shows a -0.14% Downtrend.
Bearish Trend Analysis
The 10-day RSI Indicator for ZM moved out of overbought territory on February 17, 2021. This could be a bearish sign for the stock. Traders may want to consider selling the stock or buying put options. Tickeron's A.I.dvisor looked at 21 similar instances where the indicator moved out of overbought territory. In 16 of the 21 cases, the stock moved lower in the following days. This puts the odds of a move lower at 76%.
The Stochastic Indicator demonstrated that the ticker has stayed in the overbought zone for 8 days. The longer the ticker stays in the overbought zone, the sooner a price pull-back is expected.
Following a 3-day decline, the stock is projected to fall further. Considering past instances where ZM declined for three days, the price rose further in 50 of 62 cases within the following month. The odds of a continued downward trend are 72%.
ZM broke above its upper Bollinger Band on February 09, 2021. This could be a sign that the stock is set to drop as the stock moves back below the upper band and toward the middle band. You may want to consider selling the stock or exploring put options.


ZM to $475 and need to retest the resistanceZM to $475 and need to retest the resistance at $475 (critical lev el), if ZM passed and hold this level before or after ER, we will see ZM to ATH

ZM/Zoom RISKY areaAs you can see ZM is in a risky criteria at the moment but I believe if it breaks the FIB RET 0.382, it can climb to around 500$


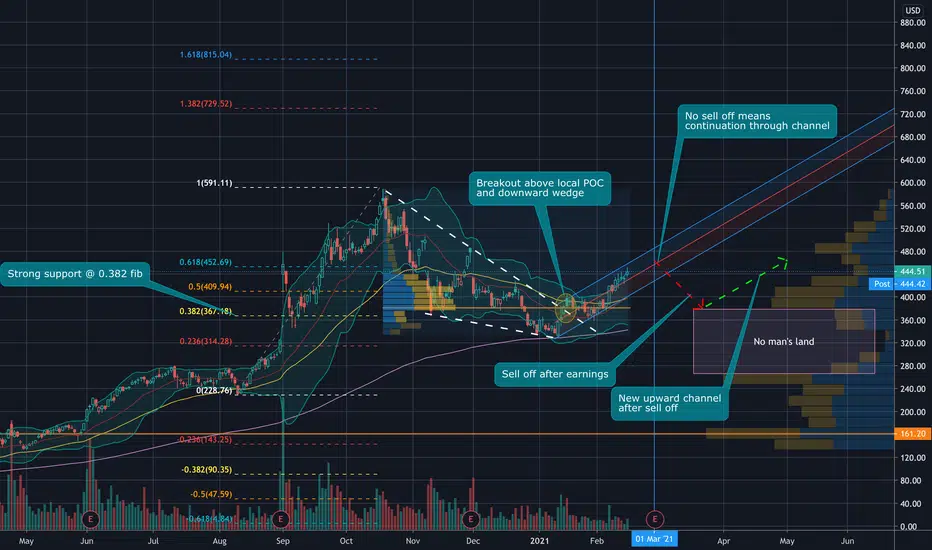
ZM Run into earningsZM should run into earnings and will likely sell off after earnings. If there isn't a sell off (unlikely), the stock should continue upward in the same channel.
ZM - February 16, 2021ZM has earnings coming up on March 1st and has been an absolute monster in revenue growth the previous year. This is attributable to COVID and securing contracts with schools, corporations and more as the general public has shifted to e-meetings. ZM had been battered in price tapping the 200 day moving average at 332, and has since found a leg higher now facing resistance at 440 area. Strong break of 440 ZM can fill gap to 478 in the short term ahead of earnings.

ZM longZm is present a possible IHS on the 4 H with a tgt of 480. If the earnings and gudiance is good, it can possibly test the ATHs

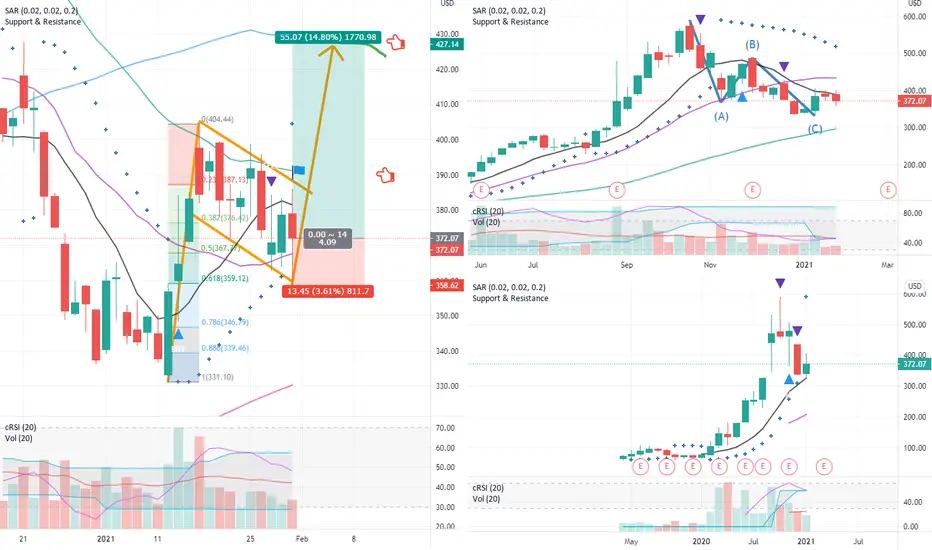
ZM is back on an upward trajectoryZM’s short- and long-term trend charts are presented. ___
Prompt: New traders should take some time and carefully read the post entitled 'You can't beat the market' that is located in my profile.
Disclaimer
The author of this text is not an investment advisor. The preceding content is intended to be used for informational and educational purposes only.
It is not an advice or inducement for the purchase or sale of the products mentioned. Before making any investment based on your own personal circumstances,
it is very important to do your own research and analysis and also take independent financial advice from a professional to verify any information provided here.

ZM just stared its journey. Cathie Wood believed in ZMZM just started his journey, a long time to go. Cathie Wood invested over 3M shares of ZM around $400 so I'm sure ZM will be in her list for 4,5 years.
ZM bulls need to push the price above $475 and hold it tight to continue to hit ATH. I'm sure we will see many interesting things in the next couple weeks, and ZM will have big earning in March. Imagining if it could beat earning again, might soon to join S&P500

ZM - Rising Strength and Trending indicatorStrong weekly closure for last 2 weeks
Improving RSI from 51 to 65
Direction movement indicator signaling upside
Trending indicator value improving
There is 12EMA crossing upward of 50EMA
These confirmations suggest higher probability of price rising.
Buy if price stay above 430
Weekly closing basis Stop Loss = 419
Targets 460, 504 derived from Weekly Fibo 0.618 , 0.786


zm bull flagzm may show strength as other nasdaq stocks show weakness the next two weeks. i have marked a bull flag pattern that is looking to burst to the upside. 2 tgts are marked at 50 and 100 daily sma. weekly shows zm completed abc corrective move and higher highs are in its future barring overhead resistance from most of the SMAs. caveat emptor.
ZM - Ready to breakoutHere is an analysis from a newbie. I think the indicators suggest a solid move. Let me know what you think.

Potential Inverse Head and Shoulder pattern in ZMIHS pattern in $ZM above $435 on closing basis. Stop on $428 trigger. first target $470 then $508.

$ZM - Bear to Bull$ZM – Bear to Bull
Been waiting to re-enter $ZM. Mapping out my plan – any dip looks good to me now. Held 200 day EMA and gap filled – looks like it will break the 100 day, break out of bullish pennant, following fib zone, held vol profile. Technical and Oscillators are generally positive. RSI and MACD curling up... be nice to see three white soldiers.
NASDAQ:ZM

💻 Zoom: Technical Buy, Fundamental Sell 💻ZM (Zoom Video Communications Inc) was one of the companies that benefited most from the Covid pandemic. Revenue literally quintupled during one year and stock prices soared up to all time highs of $588.84 in October last year. Buying interest has faded since then, stocks currently trading 27% below these highs. The local low on 12 January was almost 44% below the all time highs, so a rather significant pullback during a 3 month period.
I have recently gotten back into Zoom and I explain my rationale below. Please note my core strategy is swing trading utilizing price action, volume and order flow.
📈 Technicals 📈
Since the all time highs in October last year, a wedge pattern with accompanying volatility contraction has developed on higher timeframes. We got an upside break on 15 January, when prices gapped up, followed by 13 days of sideways movement. That's when I started watching closely and mapped out several scenarios for a potential entry. I wanted to see the wedge resistance turned support holding and moving average to carry the price. We got both of these. Next step, I wanted to see a defined local resistance breaking to the upside on a pick up in relative volume. We saw that as well and you can see on the chart below exactly when and where I entered.
My first reference point was the $427.76 pivot level, which we cleared with a close above. This sets up my trade for a first profit target at the $485 level and second target being the all time highs at $588. In other words, still significant upside potential for anyone considering a buy at this point in time.
📊 Fundamentals 📊
Now important to note that my trade is based solely on the technical factors in this case. Fundamental analysis is not so encouraging with the projected growth being conditional on the world transitioning fully to a working from home environment.
But not only that, Zoom needs to be the best virtual conferencing platform out there. Which won't be easy to say the least with significant competition from Microsoft, Cisco, Google, Amazon, Apple, etc. The increasing competition will put pressure on growth and profit margins. And the sooner we start transitioning into a post-pandemic environment, the worse for the company as the growth we have seen is solely due to this external factor.
📝 Summary 📝
I'm currently long Zoom stock based on price action and order flow. My profit targets are defined for the short to mid-term. I do not recommend a long term hold for reasons explained in the above paragraph on fundamentals.

Zoom Video Communications Is BullishIf the pattern is confirmed to be an expanded flat then we will see the price head to $588 in the coming days. There is also a possibility of price breaking the last low at point c first before heading north, that's how this pattern sometimes behaves. Don't miss this. Like and share this chart with all your friends so they can benefit from this analysis. Thank you.

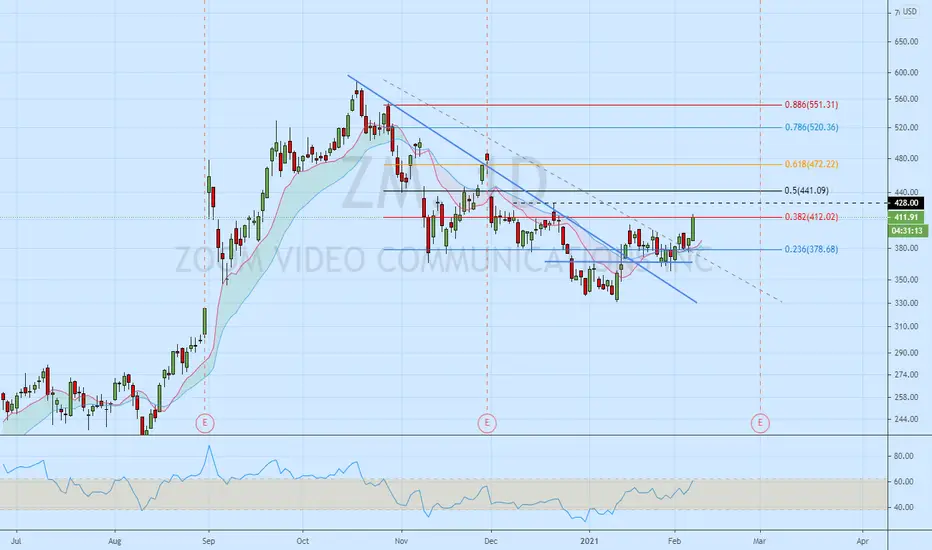
ZM 382 break on watchI am still in this trade from my initial post on on Dec 29. Check out the two posts below. We now have another opportunity to enter or add to an existing position. Price has run up into 382 fib resistance. If price can consolidate here and break above 412.. a push to 425/440 and 470 is possible. ZM has earnings on Mar 1st which may provide a longer term momentum catalyst. ZM is also held in two ARK funds which provides conviction for many trader/investors.
Additional Info:
I am an intraday scalper and short term swing trader of stocks & Futures using options and equity.
I focus on high volume momentum stocks in strong uptrends.
My time frame is between 5minutes to 5 days on most trades.
I scale into positions and scale out of positions as my targets are hit.
I always trail my stops after T1 is hit to reduce risk and lock in gains.
If my post is on a Weekly/Daily/240M chart the idea is a swing trade.
If my post is on a 60M chart or lower the idea is a day trade.
Day trades can turn into swing trades if the stock is strong.
All trades should be supported by market direction.
Treat my posts as trade ideas and not signals.
Traders must trade using their own back tested trade plan and rules.
Traders must plan risk first and profits second.
Happy Trading!