$VRA $0.10 INCOMING?!Here is my analysis on Verasity, great coin to hold onto will do really well. Let me know what you think.
VRAUPUSDT trade ideas

VRA to resume run to price discovery?Verasity (VRA) had a dizzying run in october but has taken time to chill for a week or two now. Is it nearly time to get back in the rocket ship?
While VRA is trying to make 0.071 stick, I feel if it suddenly loses this support, we'll see it drop to 0.068 and possibly as low as 0.064 to test support. No harm setting some buys there if you want to stock up on this long term monster project.
Next stop if we move back upwards is around 0.25c in my opinion.
I am bullish on VRA overall, and I think by end of year we'll be getting close to $1, although I think we will fall short in this particular run. Personally, I'm taking profits at 0.65-75c, but I will be holding the bulk of my bag for longer.

VRA Price Action PredictionVRA Price Action Prediction
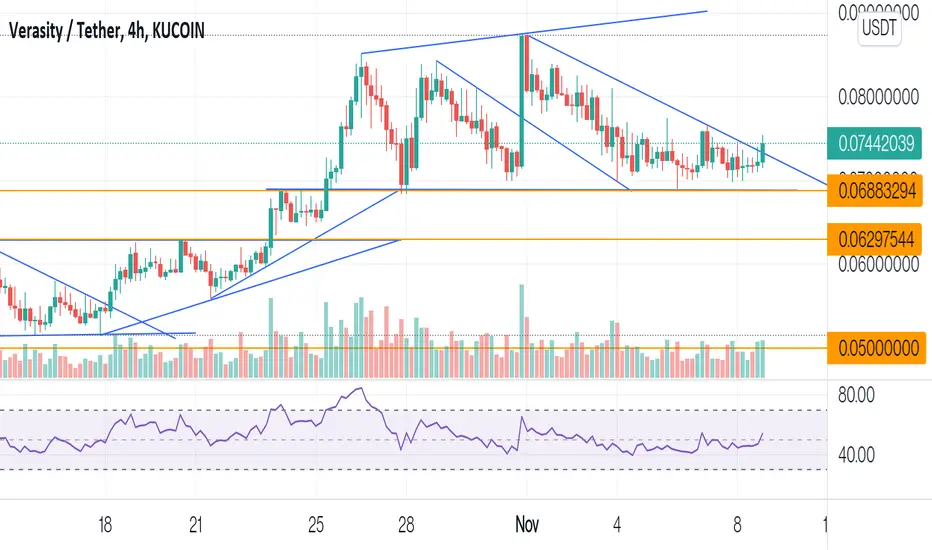
I buy to Some VRA 0.68 $
Major Support zone is 0.37


$VRA gonna test 7$VRA wants to hard test 7 cents. Hopefully she will bounce nice and follow the Captains lead (BTC) NFA


$VRA Reversal Incoming.$VRA reversal doji prints on the 12H time-frame. Stronger buy volume coupled with bounce from .07c FIB level, MACD + RSI and 34 EMA bounce suggest reversal is coming. Pamp it and HODL!

$VRA is still in the channel$VRA is going up to find the resistance, going up in this channel is very fast as seen in the last ones.

VRA - New ATH 4 hour chart is showing MACD crossover, RSI curling up, tri star doji reversal pattern. 1 hour candle close could end with a dragonfly doji. We are not many days from going ATH as long as BTC goes consolidate between 63k and 59k. Support at 0,07 is holding strong soo its low risk entering now if u haven`t and use a sl of 5% from entery.

VRAUSDT Path, Nov 6This is my idea about VRAUSDT path
Breakout from any side of triangle is important
Nothing further

just my opinionneed your ideas. i'm noob. i think if Vra break the trendline we can expect 0.085- 0.09 range soon

Buy in veracityA good buy position on verausdt ...price move down in PRZ if confirmation candlesticke you can buy

Update on VRAHappy that VRA is holding this range, if we continue to trade sideways in the range I am looking for a sweep of the lows, maybe down to the daily OB with a bounce back into the range, entry on the retest once back inside the range, this would be a Wyckoff spring which should send price to the top of the channel and hopefully our next breakout.
Otherwise just trade the range, if price reclaims the 4HR OB and then the centre of the range expect it to reach the top, if breakout doesn't happen short back to the middle/bottom of the range, rinse repeat until it decides to go one way or the other.
Manage your risk, good luck.

VRA 2021 vs XLM 2017 fractalSaving this for my own notes but I'm sure others will find this interesting, thanks @TechDev_52 on twitter for finding this fractal, or at least that's where I found it.


$VRA Small Reversal Incoming$VRA If/when listing news is dropped, all FIB targets are off and $VRA moons. Paytience is the key to $VRA as the fundamentals will take months and years to be realized. Selling $VRA @ $1.00 is selling $AMZN @ $100

VRA curved channel and trajectoryAn update on VRA trajectory, it looks like it will start an uptrend soon. Take a look at my previous chart on it, still on channel track.
The formation shows that even on market downtrends, it stays strong on its feet. A lot of accumulation ready to ramp up. The potential is there.
MAGENTA CHANNEL
This is a curved projection channel created upon a bounding box. The chart is presented over a LOG price scale. For its creation we use 3 "curved line boundaries" that cover the center, upper and lower limits for potential movement. Even if this not an attempt to forecast a trend or future scenario, it allows to have an easy to read view of probable limits and oscillation parameters.
Just sharing my personal charts for learning purposes only. This is not an investment recommendation.

$VRA is on the move$VRA lets see if she can punch her way out of this one. 30 minutes in good volume. NFA

VRA long bullflagI think VRA will break out very soon. RSI going to 40, we are ready to fly again 🚀🚀🚀


