VRAUSDT correction is done time to flyVRAUSDT is presenting a clear completion of a WXY corrective structure into the defined Area of Interest, offering a potential re-accumulation opportunity. Price is currently reacting from the major demand zone with initial upside targets around 0.005284 and a secondary target aligning with the Supply Zone of Interest near 0.015081. The overall structure suggests a corrective phase conclusion with prospects of a new bullish impulse. Future validation will depend on sustained bullish momentum from the current demand area.
VRAUSDT.P trade ideas


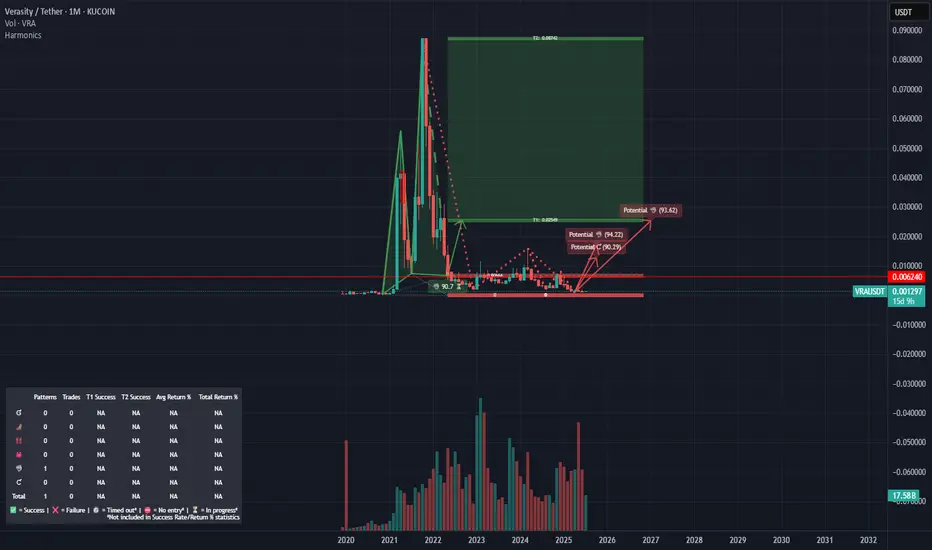
VRA1M chart shows harmonic pattern to 8 cents. Looks like a good time to get in if you believe in alt season
Continue analysis on VRACompleting my analysis of this currency from a year ago, we find that it has actually fallen, and according to the new data that has appeared, a triple flat has been formed, and a new strong fall to the area below is expected, and all the data is shown on the chart.
*In principle, I am not a supporter of any direction, but I am only giving my point of view, which may be right or wrong. If the analysis helps you, then this is for you. If you do not like this analysis, there is no problem. Just ignore it. My goal is to spread the benefit. I am not one of the founders of the currency.

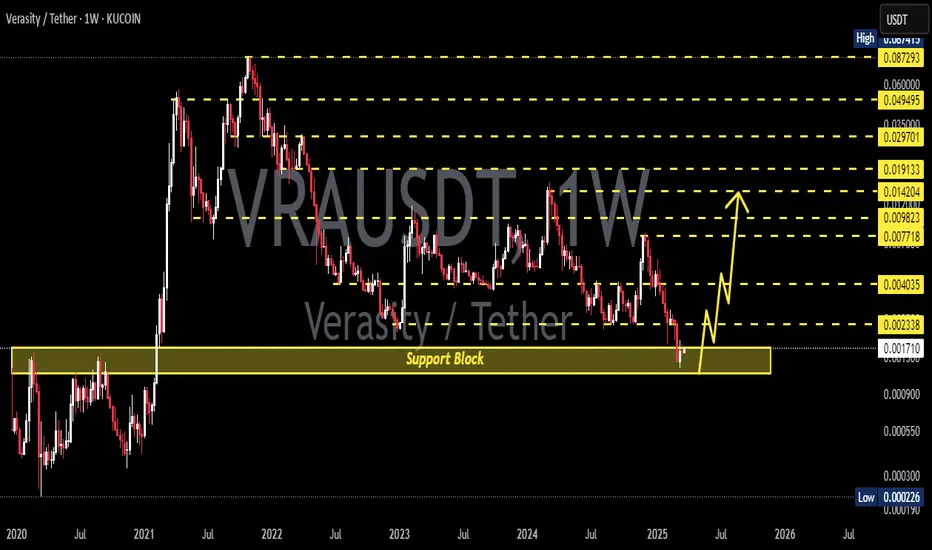
VRAUSDT 1W AnalysisVRA ~ 1W Analysis
#VRA Buy back gradually from here if you still have confidence in this coin with a short-term target of at least 20%++ from this support block.

bullish??If it consolidates above the 0.00245 fractal, it has the potential to grow to the next high.

My VRA 15 minThe VRA/USDT chart displays a strong bullish structure following a clean bounce from the 1.618 Fibonacci extension, likely marking the end of Wave C. The price has reclaimed the 1.267 Fib level and is forming higher lows, indicating a potential start of Wave 3. RSI remains above its moving average, suggesting strengthening momentum, while MACD has crossed bullish with a rising histogram. Current resistance lies near the 0.618 retracement zone of the prior drop. As long as price holds above the 0.00200 support zone, the bullish wave count remains valid and may target 1.618 extension near 0.00245 next.

My VRA 1 hr chartThe VRA/USDT chart displays a strong bullish structure following a clean bounce from the 1.618 Fibonacci extension, likely marking the end of Wave C. The price has reclaimed the 1.267 Fib level and is forming higher lows, indicating a potential start of Wave 3. RSI remains above its moving average, suggesting strengthening momentum, while MACD has crossed bullish with a rising histogram. Current resistance lies near the 0.618 retracement zone of the prior drop. As long as price holds above the 0.00200 support zone, the bullish wave count remains valid and may target 1.618 extension near 0.00245 next.

VRA ChartThe VRA/USDT chart displays a strong bullish structure following a clean bounce from the 1.618 Fibonacci extension, likely marking the end of Wave C. The price has reclaimed the 1.267 Fib level and is forming higher lows, indicating a potential start of Wave 3. RSI remains above its moving average, suggesting strengthening momentum, while MACD has crossed bullish with a rising histogram. Current resistance lies near the 0.618 retracement zone of the prior drop. As long as price holds above the 0.00200 support zone, the bullish wave count remains valid and may target 1.618 extension near 0.00245 next.

Verasity $VRA crypto chart🟩🟩🟩🟩🟩🟩🟩🟩
🥃 #VRA PUMPING
🚀🚀🚀🚀🚀🚀🚀🚀🚀🌔✨
STILL A LONG WAY TO GO YET.
If you bought the lows on this, you’d making plenty. www.tradingview.com
🟩🟩🟩🟩🟩🟩🟩🟩

Verasity: Your Altcoin Choice (S2)I will do a new Top Altcoins Choice session next week so if you missed the previous two sessions you can participate in the next one. You can choose any Cryptocurrency project you want and I will publish an analysis for you.
Today we are looking at Verasity (VRAUSDT) on the daily timeframe. It has a standard chart for a Tether (USDT) trading pair.
Volume started to grow in November 2024 and remained high.
Bullish volume is high in relation to bearish volume as VRAUSDT hit a major low. The correction bottom.
High volume was present 10-March and 7-April. Two decisive points and both ended green. A reversal comes next.
There is a downtrend and this downtrend has been compromised, it is no longer safe.
It has been broken and there is an initial bullish breakout, the retrace led to the test of the descending trendline, once resistance, as support. This is classic trend reversal behavior. The first reaction is always corrected into a higher low before additional growth.
This is the start of a major bullish phase. Verasity hit the lowest price since early 2021. There can be growth for months or even years. This is as good as it gets if you are a buyer, prices will not go lower. This is the best time to enter if you are considering a LONG (Bullish) trade.
Thank you for your support, I am wishing you the best.
Namaste.

VRA has a long way to go on the weeklyThis shows VRA on the weekly. Looks like this would could go for 28 days to the top. Keep looking for the negative divergence on the 3 day.

Please be carefulIn principle, I am not a supporter of any direction, but I am only giving my point of view, which may be right or wrong. If the analysis helps you, then this is for you. If you do not like this analysis, there is no problem. Just ignore it. My goal is to spread the benefit. I am not one of the founders of the currency.
It appears in front of me. According to Elliott's rules, this is a triangle consisting of five internal waves. This is considered a B wave, and then it falls again in a final C wave. Confirmation of the trend is when it breaks the top of wave D, from which this decline is confirmed. The analysis fails only if it breaks the top of wave D. Good luck

vra usdt entriesvra usdt. good project as we all know. but the pattern looks unfinished. based on liquidity pools and demand zone that will be a great entry point in my opinion. nfa


How about this chart?? I think Vra is like any other altcoin is in the sale zone, even though it hit a historical low.
Just look at the technicals in every other coin you will see it, all coins will thrive the moment risk-on markets comeback after positive news

VRAUSDT 1WVRA ~ 1W Analysis
#VRA Buy gradually from here if you still have a Conviction on this coin with a short -term target of at least 20%+.
Veracity end of wave 2 or whatI can see a 5 wave move up for the wave 1. Now trting to find the end of wave 2. We totaly backtested the top of wave 1 also lining up with a fib level. If we break the upper trendline we could be in a wave 3 making ath. If we dont we will go for the other 2 to jump in.

$VRA can break out soon#VRA can creak out this resistance and be projected to the next one around $0.004.
All depends by the news and overall the crypto environment

I think this is solid for vraKUCOIN:VRAUSDT
This is the core of the technicals for vra in my opinion.

VRA VRAUSDT
this is my latest update about vra in WXY correction
it took very long time to start bullish not just bra but all alt coins
target is 0.14000

VRA in 2025#VRA has been in a bearish trend since Oct 2021. The current price action isn’t bullish enough, so another dip is likely before a strong reversal.
The $0.00160–$0.00130 zone looks like a good buying area.
Passing $0.00815 confirms a shift.
Long-term hope remains as long as it stays above $0.00034.
#Verasity

VRAUSDTVRA over 0.002121 still shows very bullish
we are going to see huge pump soon on next 4 months
this is what shows in all altcoin structures not only vra
but vra market cap is only 23 million so any extra millions enter the market it gonna directly affect on price
