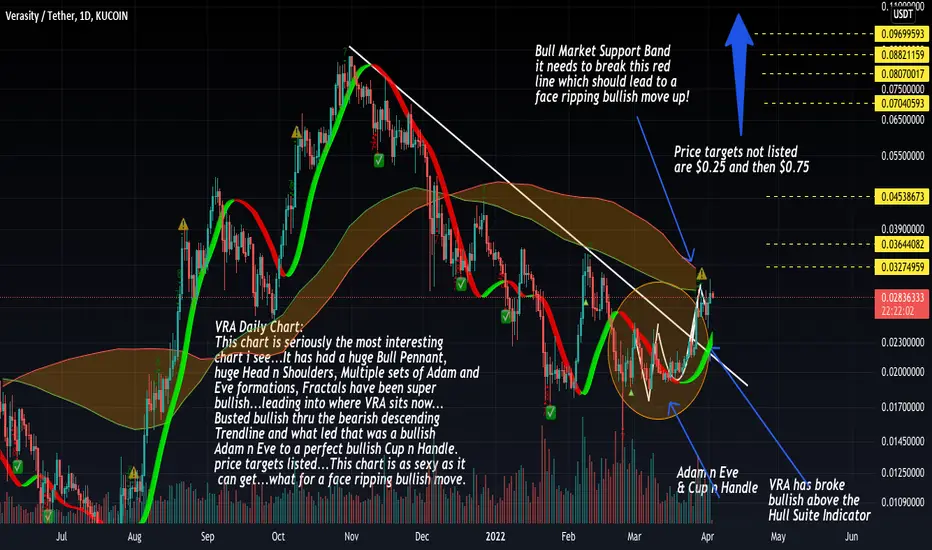
VRA daily chart is going to RIP your face offVRA Daily Chart:
This chart is seriously the most interesting
chart i see...It has had a huge Bull Pennant,
huge Head n Shoulders, Multiple sets of Adam and
Eve formations, Fractals have been super
bullish...leading into where VRA sits now...
Busted bullish thru the bearish descending
Trendline and what led that was a bullish
Adam n Eve to a perfect bullish Cup n Handle.
price targets listed...This chart is as sexy as it
can get...what for a face ripping bullish move.
VRAUSDT trade ideas
VRA breakout?I see a bullish pennant forming on the 15-30 min chart, which looks like we might be seeing a nice breakout to to the upside.
I could see this going to 0.0325-0.035 zone within a day or two possibly a nice set up
Volume is also very large (almost 1 billion) and the market cap is still under $500 million
leaves me to think that we might see a lot of money pouring in IMO
*NOT FINANCIAL ADVICE*
Anti-Hedge

VRA #longBreaking the trend line
spot position (#long)
Tp1: 0.0248
Crossing TP1:
Tp2: 0.031
Tp3: 0.34
SL: Return below the trend line (1D)

VRA/USDT Aiming 70% gain mappedHello Traders
VRA/USDT has broken symmetrical triangle and confirmed above it.
In this scenario VRA can reach 0.05 $ so that's actually going to be a 70% gain.
Since market is a little bullish due to BTC gains , most likely continuing upward momentum is probable.
Stay Safe
Thanks for Reading
-RC

VRA bullish hoping for a 30% gainVRA is showing a falling wedge and is looking to go up 30% if the market stays bullish

$VRA 310322Verasity daily chart. Orange line is key no monthly close below since February 2021. Flipping to support on weekly/monthly=super bullish.

Verasity VRA price movement prediction Price movement prediction
not financial advise
for entertainment only
make sure to like and follow


VRA diamond in important reversal zone?!?Currently this diamond VRA is still in a downtrend. This because of all the mess we see within Russia/Ukraine.
From the chart we see that there are some serious support levels at 0.019 (current level), on 0.012 and even on 0.007. This last number was also hit on June 2021 before it made a massive 1000% movement!! This could very well happen again!
The downtrend will be broken if the daily candles can stay above 0.022!
Lets pray for Ukraine, but also for btc/vra to recover and make us rich as ….
Cheers!

VRA updateVRA reclaimed the bottom of this key channel that I have been waiting for.
If you're not already positioned waiting for a successful retest of the bottom of the channel would be your best entry, if it comes.
I think we may see a push as high as 0.03 if $BTC does push higher before a corrective move. Although maybe alts get a run while BTC cools off... we'll have to wait and see.
Still following the same plan. A successful S/R flip of the bottom of the channel should see us move to the centre of the channel at 0.036. If/when we get there we wait and see what happens.
Have a good week.


VRAUSDT Daily Timeframewill it break DTL this time? higher probability comparing to previous trial and low distance from area of interest for the hodler
#TAYOR

Fantastic entry point for Verasity. 300% to ATH 🐱🏍Verasity (VRA) is a protocol and product layer platform for esports and video entertainment.
Total market cap is around 100 million.
The 3day chart shows a strong sign of recovery and can be taken as a future outlook of the weekly.
Bullish stuff:
We did find a strong support around 0.02$.
Currently it looks like we get a W shaped recovery which is one of the more reliable patterns.
The RSI shows a strong healthy rise.
Trading volume is increasing even during the price drop. This is a good sign for an upcoming recovery.
Bearish stuff:
We did not create higher highs yet and are in a consolidation phase during a down trend.
Technically we are still not above the bull market support band consisting of the 20 week SMA and 21 week EMA .
As a middle cap altcoin VRA heavily depends on the health of Bitcoin and Bitcoin did not break the bull market support band yet.
VRA keeps integrating and developing.
Check their Roadmap for 2022 on their official website.
A 1 billion market cap seems not out of the cards which is a 10x from here.
It could take some weeks but we believe that VRA will rise again.
Feel free to comment or ask anything you like.
Always do your own research and keep in mind that my charts and comments cannot be considered financial advice.
Cheers
Ctumblery

VRA descending channel breakout and retest completedVRA/USDT has corrected 82% from its November highs and into a HTF weekly supply to demand flip zone where it has broke out of downtrend resistance and retested with high volume. Its formed a high volume bottom with pin bar on weekly with highest volume on the chart since inception, price has since formed an uptrend on the daily putting in higher highs and higher lows.
Weekly structure is bullish respecting uptrend putting in a new swing high and this could be the formed higher low and the start of a new move to the upside and new leg.
RSI on 3d looks reset as like the last leg up, above the MA with bullish divergences. MACD on weekly converging showing momentum coming into the market.
Great fundamentals on VRA and definitely a good buy here imo

VRA Quick Scalp TradeVRA Scalp
Entry @ current price 0.0229
TP @ 0.032 - 0.034 (minumim)
Time Period - Can pop anytime in the next 24 hours to 5 days
Expected timeframe - 1 to 2 weeks
This trade is strictly for spot and not futures

VRA Looks good New to TA and all of its varietals. Looks like it could launch soon if volume picks up. What do yall think? I made the chart a week ago or so and just looked at it again and it seems consistent KUCOIN:VRAUSDT

VRA / Daily0%VRA / Short term
Market Cap is sitting $102,253,774
Way oversold,
Classic flag in reaccumalation phase.

VRA Veracity can break the triangle an reach $0.08 or $0.1There are a bigger triangle breaking, but everything is up to the line of support of the smaller one. If the $0.02 support tail we are seeing a re-test of $0.018 area before breaking up.
If it breaks right now we can see VRA be directed to ATH, possibly by June, with a price around $0.08 or even $0.1 with a max given by the corridor of $0.120.


VraMy guess is green.
In weekly 👇
Macd isn't good but
Has good volume.
Don't forget the stop loss.
Good luck.
