$VRA: 3 possible scenariosAnalyzing #VRA I can see 3 possible scenarios:
- 1st we continue the bullish sentiment and we stay on top of the trend/support line and break out
- 2nd we instead break down the support/trend line but we stay into the flag and we go a little bit in correction mode touching the bottom of it
- 3rd it goes a little bit in a correction mode (very doable after all that gain) and we stay into the bullish flag to come back stronger than before
In all the 3 scenarios I'm very bullish and see #VRA flying at 0.2 this BR, especially after Finance will list it in less than 30 days!
What do you think?
VRAUSDT trade ideas

$VRA couple of ups and downs forming a bullish flagYesterday we successfully filled all the buying orders, make some bucks on that rally up but now is time to understand what is next for #VRA.
I don't see it done yet, probably is forming a W or a bull flag, either we are going a little bit side way with ups and downs that we can take advantage of.
I'm in a good position still from the buy order of yesterday's dip, but I'm setting up a new buy order at 0.0058.
For now it should be enough to take advantage of this market, if it breaks up great, we filled the bags, if not, maybe there is space for another dib to 0.0055/58

Short terms idea for $VRA#VRA is super bullish in my opinion, and I'm expecting short terms gain. In long terms I can still seeing VRA breaking the bearish weekly resistance within 3-4 weeks, but before I see it going to re-test lower levels, around 0.006.
Thoughts?

VRAUSDT - Very Bullish On This OneA low cap alt but one that shows its bullishness
I think price could move from where it is now way further up into the .C range and possibly even moon to a $
Similar areas in the boxes
Bullish daily chart

$VRA last chance to get it cheap before the take off!#VRA is getting HOT!
I see a last sip down before the take off, where I see it going to ATH and over.
In my opinion it can reach 0.2$ this Bull Run.
My open orders are in the buy area of 0.005, 0.0055 and 0.00651.
Have fun!

#VRA/USDT is heading towards the Sell-side Liquidity.#VRA/USDT is heading towards the Sell-side Liquidity. Wait for SSL to be taken and tap towards 4H FVG.
The local resistance level is PWH $0.007844.

vrausdt ideaDaily structure. Two possible scenario. If price close above 0.0089. Can entry at horizontal key level as mark.

Long-Term Accumulation Strategy for VRAUSDTIn this analysis, we focus on a long-term accumulation strategy for VRAUSDT. The chart reveals key levels where accumulation could potentially yield significant returns, based on technical indicators and historical price action.
Accumulation Zones:
$0.00512: Identified as an accumulation entry point for 10-20% of your position. Potential price movement of approximately 5-10%.
$0.00385: Stronger accumulation zone for an additional 5-10%. Potential price movement of 10-15%.
$0.00252: Critical demand zone, optimal for accumulating 10-20% of the position. Potential price movement of 15-20%.
Distribution Zones:
$0.01168: First major distribution zone for partial distribution of accumulated assets (1-5%). Potential price movement of 120%.
$0.01636: Next distribution zone for further distribution (1-5%). Potential price movement of 220%.
$0.02091: Higher distribution zone, ideal for 1-5% distribution. Potential price movement of 310%.
$0.03082: Ultimate distribution zone for significant returns (5-10%). Potential price movement of 500%.
Price movement along these trend lines provides clear entry and exit points.
Increased volume at support levels indicates strong buying interest and validates accumulation zones.
Current market sentiment shows potential consolidation with bullish reversal signals supported by trend lines and volume analysis.
This long-term accumulation strategy for VRAUSDT focuses on systematically entering positions at identified accumulation zones and distributing at key distribution zones. This methodical approach aims to capitalize on both the technical patterns and market sentiment, ensuring a balanced risk-reward ratio.

Simple analyse / verasity!The $0.01 level is the most challenging to break. If we can close a daily candle above it, we have a strong chance of surpassing the previous all-time high.
My prediction is that we could see a range between $0.20 and $0.50 after the breakout.

Great set up R/RIts not the time to be scalping, i would say its a better deal to buy and chill. Alt season is warming up targets gonna hit and im sure gonna go a lot more higher. Release the bull

Vrasity ( vra)Vra usdt analysis
Time frame daily
Risk rewards ratio >6.5 👈👌👈👈👈
Target 0.0118$
Very very good pump

VRAUSD - Bullish RSIAs we enter a strong bull market altcoins like this one pop up all over the place
The flat horizontal nature of the RSI suggests the trend is changing
This RSI has been flat for 853 days, being in a bull market its only a matter of time before the breakout occurs.
Keep an eye out for RSI's like this on other Monthly chart coins as it means they are most likely in the early stages of a moonshot.

VRAUSDT | Buy Now, Thank Later | Near Term (4HR)VRAUSDT | Buy Now, Thank Later | Near Term (4HR)
Its Ready To Go, Perfect Buy
BTCUSDT | Alts Poised to Explode | Near Term (2H)
MYRIAUSDT | Interested to see where this goes | Mid Term (2D)
Mock Up Price Action for VRA w/ Timeline | Mid Term (3D)
Mock Up Price Action for XCH | Mid Term (12HR)
OGNUSDT | Interested to see where this goes | Mid Term (3D)
Mock Up Price Action for CSPRUSDT | Near/Mid Term (2D)
VIDTUSDT | Interested to see where this goes | Mid Term (3D)
RAREUSDT | Interested to see where this goes | Mid Term (3D)
Mock Up Price Action for ALGOUSDT | Mid Term (12HR)

VRAUSDT | Buy Now, Thank Later | Near Term (4HR)VRAUSDT | Buy Now, Thank Later | Near Term (4HR)
Money flow... BTC, then ETH, then Large Caps, Then Mids and Smalls
Additional altcoin near term and midterm chart ideas listed below
Timeline of events for the Bull Market indicated on chart
CSPRUSDT | Buy Now, Thank Later | Near Term (4HR)
PERPUSDT | Buy Now, Thank Later | Near Term (4HR)
TLMUSDT | Buy Now, Thank Later | Near Term (4HR)
DODOUSDT | Buy Now, Thank Later | Near Term (4HR)
LPTUSDT | Buy Now, Thank Later | Near Term (4HR)
VRAUSDT | Buy Now, Thank Later | Near Term (4HR)
XCHUSDT | Buy Now, Thank Later | Near Term (4HR)
CSPRUSDT | Buy Now, Thank Later | Near Term (4HR)
VELOUSDT | Buy Now, Thank Later | Near Term (4HR)
UMAUSDT | Buy Now, Thank Later | Near Term (4HR)
OGNUSDT | Buy Now, Thank Later | Near Term (4HR)
DOTUSDT | Buy Now, Thank Later | Near Term (4HR)
VIDTUSDT | Buy Now, Thank Later | Near Term (4HR)
BTCUSDT | Alts Poised to Explode | Near Term (2H)
Mock Up Price Action for ALGOUSDT | Mid Term (12HR)
MYRIAUSDT | Interested to see where this goes | Mid Term (2D)
Mock Up Price Action for VRA w/ Timeline | Mid Term (3D)
Mock Up Price Action for XCH | Mid Term (12HR)
OGNUSDT | Interested to see where this goes | Mid Term (3D)
Mock Up Price Action for CSPRUSDT | Near/Mid Term (2D)
VIDTUSDT | Interested to see where this goes | Mid Term (3D)
RAREUSDT | Interested to see where this goes | Mid Term (3D)

Long VRA on retestVRA did a nice breakout yesterday. Ofcourse very bullish for coming months, however a nice entry would be the grey box which is a retest area as well falls in the fair value gap. I would enter at the marked weekly order block, which is around $0.003856. Easy mid term target will be 3.618 fib level. Cheers!

Don't miss out on #VRA#VRA has seen MASSIVE GAINS during the last bull run and current TA is looking very positive for this project ready to take off!
We have a double bottom on the weekly as well as a nice bounce from MA on the RSI.

VRAUSDT - Long Trade Price Action Update...In this video, I take a deep dive into the long-term chart analysis to show why we're currently trading wave (C) higher as part of the move toward the end of wave D.
This isn’t Elliott Wave—it’s AriasWave, a methodology I developed over eight years. Sure, I might call myself a genius, but that only holds true if it helps you make money—otherwise, I’m just another clown, right? Jokes aside, no one explains these charts quite like I do, and I’m here to help you turn insights into hard-earned fiat dollars.
So, grab a stiff drink and get ready to dive into AriasWave! I’ll be teaching it here for free, right on this channel.
Is there a specific aspect of AriasWave or this analysis you’d like me to focus on?
Drop it in the comments.
See the original long trade idea chart linked down below. You're welcome.

VRAUSDT - Give Me $1 TargetSimilar horizontal movements can be seen between now and prior pre-bullrun
I think we are on the verge of another big move
LETS HIT $1 !!
A big move but I don't think its impossible.

vrausdtit looks crazy but in 2021 i draw the same for coti and it went right to the target although i was a beginner and sold way too early to try and build more coti. vra $1.56 life changing

VRAUSDT - Long Trade Idea - Don't F*ck This Up...If you don’t know when to exit, don’t enter. Aim for the previous high as your target for a solid profit—take it or leave it.
This is good for a leveraged trade or not.
Entry: .003726
Stop/Critical Support Level: .003014
Take Profit Target: .016215
See the related idea linked below.

VRAVRAUSDT
very bullish after breaking 0.004200
can increase 25 % as the market cup is only 33 M at the moment

VRAUSDT - Price Action Update With Long Trade Idea...In this video, I explore how I believe Bitcoin’s corrective pattern has played a significant role in shaping the current pattern we’re seeing here.
It wasn’t straightforward to identify at first, but once I gained a clearer understanding of Bitcoin’s pattern, it helped me form some specific assumptions about how these moves might unfold going forward.
While not every crypto will skyrocket alongside Bitcoin, some may align with its movements at certain moments.
Current Pattern: Wave D Zig-Zag
Support\Stop Level: 0.002316
Target: 0.016129
This is not financial advice.

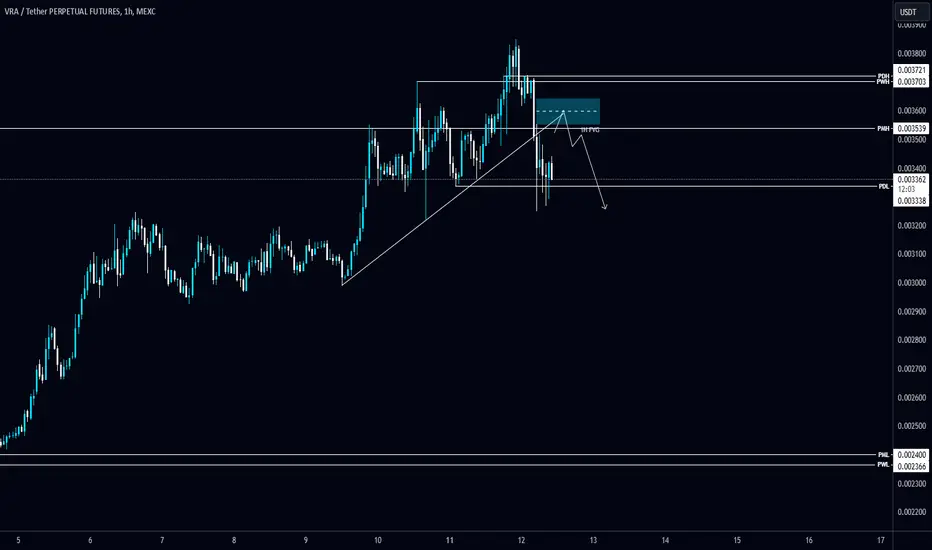
#VRA/USDT breaks the Diagonal trendline in 1-Hour TF!#VRA/USDT breaks the Diagonal trendline in 1-Hour TF!
Wait for a retest and 1H FVG to be tapped to short $VRA. The local resistance level is PMH $0.00354 and the support level is PML $0.0024.