VTHO Will Revisit 0.0012 if the Pull Back fails.The price formed a breakout and pull back on the support the bearish pressure has more potential to revisit the next supported area close to 0.0012
VTHOUSDT trade ideas

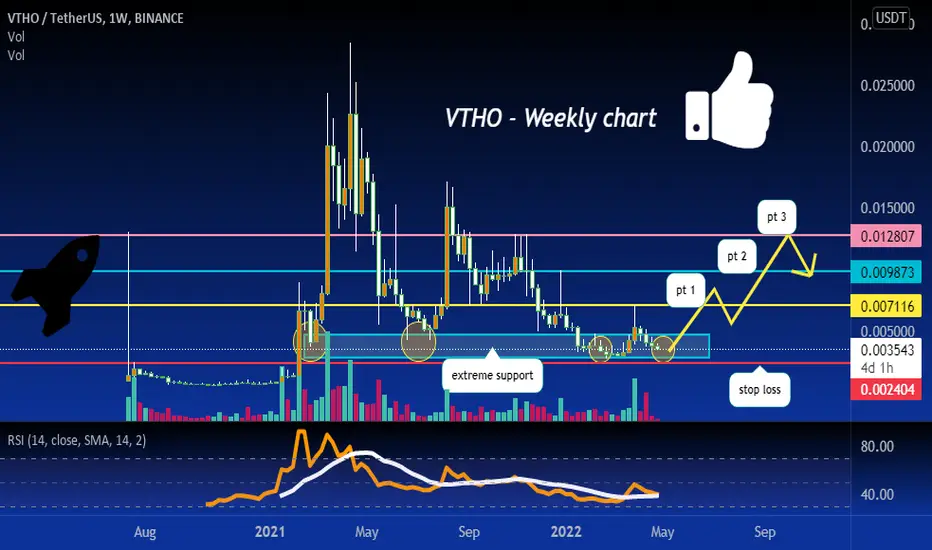
time to load up here?VTHO should see a big bounce off this support zone, good risk reward entry for longs here imo.
stop loss below support, targeting .007116-.009873-.0012807


VTH someone asked me for VTH analysis here it is but when the trend line breaks out its ready to fly otherwise it will be like that


VthoVtho tried to break the downward trendline on the weekly. If this trendline breaks vtho's gonna fly!


VTHO/USDTesting/tracking elliot wave theory. Please do not trade off idea without S/L. Not financial advice.
Link to previous chart:
The previous chart is not valid anymore as we went below the trend line. We've been looking for a bottom. It's either in or near. We can still drop another 62% and this chart is still good.
Potential 62% drop
Potential 1583% gain
RR: 25
Next target: 0.045211 (wave 3)

VTHO USD CRYPTOVTHO 4 hours time frame chart with parallel channels and prediction of the next target price

$VTHO- Free Gas If $VET hit and break through that 0.068 resistance, 40-90% in $Vtho from current EP level could fill some short term profits.
Some mini PB and for support retest and then continuation..

Bull Flag $VTHOWe are creating a bull flag pattern, also we are down 90 % from top. Good indication for a buy level. As long as BTC stays stable this will end up well.

VTHOHello
vtho ready to pump
sitting on good support
targets on the chart
sl if 4h close below 0.0032

VTHO/USDVTHO update and a quick look to the future opportunities that may arise, not just VTHO but all crypto assets, because downtrends don’t last forever.
Here is a closer look at this VTHO 1 day chart.
At the moment VTHO is below its Least Squares Moving Average (LSMA) on this 1 day timeframe. A daily close below the LSMA is considered a sell signal.
At the moment, VTHO is fighting to stay above its Bollinger Bands Middle Band Basis 20 Period SMA on this 1 day timeframe. If VTHO closes below the BB Basis and re-test it as resistance then we should expect VTHO to drop to its BB Lower Band level.
VTHO is below its Volume Profile Fixed Range Point of Control (VPFR POC) fro the fixed range of 5x daily candles that i have selected.
Zoomed out on this 1 day VTHO chart, the Volume Profile Visible Range Point of Control (VPVR POC) is around $0.001480.
For your viewing pleasure i have added various support and resistance areas as highlighted by the Horizontal Black Lines with Yellow shading. I have also added 2 descending support lines (Blue Lines on chart).
If we look at the Average Directional Index (ADX DI), we can see that Positive Momentum has dropped with the +DI (Green Line) dropping to 24.29 but Negative Momentum has also dropped with the -DI (Red Lien dropping to 19.04. The Trend Strength is weak with the ADX (Orange Line) at 19.19 and still under its 9 Period EMA (Black Line) and now under the 20 Threshold. We need the +DI (Green Line) to stay above the -DI (Red Line) on this 1 day timeframe, if not then further downwards momentum will continue.
If we look at the STOCHASTIC Indicator (STOCH) we can see that momentum is slightly upwards but i would say sideways within a range at the moment with the %K Line (Blue Line) still under its %D (Orange Line) which is a further sign of upwards strength weakness. Not that the %K Line (Blue Line) still has room to drop before becoming Oversold on this 1 day timeframe. Be on the lookout for when the %K Line (Blue Line) strongly crosses back above the %D (Orange Line) on strong volume.
At the moment, like most other cryptos, VTHO is under the influence of BTC. With this mid to potentially long term downtrend, a lot of opportunities will soon arise because downtrends don’t last forever. Previous Volume POCs will potentially become new POCs and become area of strong volume control, be tested again as support and if it holds, it can again offer opportunities to allow you to acquire your crypto of choice at an unbelievable discount.
From the 9th Feb 2021 to 16th April 2021, VTHO did a massive rise from its POC starting around $0.00145 and eventually rising to $0.02738………. That is around a 1794% move up! You want to buy near the BOTTOM of that 1794% and sell near the TOP of the 1794%
This is just my opinion but a lot of people seem to get caught up in the hype of BTC and ETH and foolishly ignore the low cap coins that can potentually offer much higher returns and i believe that cryptos like VTHO and a few others can offer that once again, especially after this downtrend is over, even if that downtrend takes a year or 2 because we have to factor in what is happening to the economy at the moment, because like it or not, when the stock market crashes……. BTC and most other cryptos will follow.
Diversification is key.
I hope this is helpful with your trading and hodl-ing.

VeThor PampLooks like this is actually ripe for a pump. If this is a completed cycle and ATH is near, then we see .10-.14 cents on this monster by the end of the month. If the orders come in, we see .10 to .14 by the end of the week.
I can't vouch for Vethor, but I am holding until I see more action in price. I have a good feeling that people will need somewhere cheap to dump some profits... Vethor is a valid option at just under .01 cents!
Not financial advice!


Don't mind me.Just toying around with the idea that people will soon be sinking returns and whatnot into bozo projects that seem ripe for a pump.
Not financial advice. Just posting so I have something to come back to with a more well developed idea for comparison.

VTHO looking for 50% gains as it continues in it channel looking for VTho to make decent gains as it continues on it tightening wedge. Looking for the bull flag to play out

VTHOUSDT Potential reversal trend on Weekly Chart LONGHi everyone
Weekly"
Possible trend reversal from down trend if we can get to break out from Symmetrical Triangle.
There is local resistance at around $0.1 If we can over come this point we could be looking up to a reversal all the way to $0.2
Also Stoch RSI crossed up on over sold area. (After a few months now) This is a strong sign of having had reached bottom on down trend and now just looking to come back up.
ALWAYS look for extra confirmation on any trade, Anything like a bullish candle such as the one we can see here "green Inverted hammer'
Happy trading people
(No financial advice)
DISCLAIMER
The trading ideas, analysis, and comments above should not be considered financial advice or recommendation to trade or invest in any financial product. Your personal situation has not been taken into consideration in the trade ideas. This page is for general educational purposes only. Do not buy or sell any product discusses on this page before doing your own research. Always do your own analysis and research and be aware of the risks involved in trading any financial product :)

Vtho to 0,04!Huge triangle on the weekly vtho already tried to breakout, for the upcommong days expect a huge pump if we breakout.

VTHO - 1d chart updateVTHO is back above its Bollinger Bands Middle Band Basis 20 Period SMA for this 1d timeframe. Note that the Upper and Lower Bands are moving sideways and have plenty of room to expand.
VTHO is still above its Least Squares Moving Average (LSMA) for this 1d timeframe.
VTHO is still above its Volume Profile Fixed Range Point of Control (VPFR POC) for the Fixed Range of 5x daily candles i have elected.
At the moment, VTHO is still below its Volume Profile Visible Range Point of Control (VPVR POC) for this chart’s Visible Range.
Note that Volume has been increasing but the last 13x Volume Bars have closed below its Volume 20 Period MA.
If we look at the Moving Average Convergence Divergence (MACD) we can see that the MACD Line (Blue Line) is still above its Signal Line (Orange Line) and is indicating Momentum is upwards at the moment on this 1d timeframe. Note that the MACD Line (Blue Line) still has a long way to go before crossing back over the 0.0 Base Line back into the Positive Zone.
If we look at the Stochastic Indicator (STOCH) we can see that the %K Line (Blue Line) is above its %D Line (Orange Line) and has now crossed into the Overbought Zone. Being in the Overbought Zone doesn’t mean the %K Line will drop as it can go slightly higher and even range sideways within a range in the Overbought Zone for a prolonged period of time.
If we look at the Average Directional Index (ADX DI) we can see that Negative Momentum has dropped with the -DI (Red Line) dropping to 21.60. Positive momentum has risen but is now slightly sloping down at 18.40. Not that the Trend Strength is still strong with the ADX (Orange Line) at 25.26 but note that the ADX (Orange Line) has dropped below its 9 Period EMA (Black Line) which is at 26.86 so the ADX has lost some Trend Strength but its still good because the ADX is still above the 20 Threshold. Be on the lookout for when the +DI (Green Line) crosses back ABOVE the -DI (Red Line) which will indicate that Positive Momentum is now dominant over Negative Momentum on this 1d timeframe.
Here is a wider view of this VTHO 1d chart:
Note that VTHO is in a Massive Symmetrical Triangle Type Pattern on this 1d timeframe.
I have added a few Support and Resistance Areas of interest indicted by Horizontal Black Lines with yellow Shading. At the moment VTHO is trying to get back above its first resistance area. A successful close above this level will be a very good sign for continued upwards momentum.
I hope this is helpful with your trading and hodl-ing,
Notes:
LSMA = Black Squiggly Line on chart
Bollinger Bands = Grey Bands on chart
VPVR POC = Long Horizontal Red Dotted Lines on chart
VPFR POC = Short Horizontal Red Dotted Lines on chart
Resistance and Support Area = Horizontal Parallel Lines with Yellow Shading on chart

VTHO - quick 1d chart updateNote that VTHO is in a Descending Channel on this 1d timeframe. VTHO is also potentially in a Symmetrical Triangle pattern.
VTHO is still below its Bollinger Bands Middle Band Basis 20 Period SMA for this 1d timeframe. Note that we may see the Lower Bollinger Band start to curve inwards if upwards momentum continues.
VTHO is back above and has closed yesterday’s daily candle above its Least Squares Moving Average (LSMA) for this 1d timeframe. A close above the LSMA is a buy signal for traders who use this indicator.
VTHO is still below its VPFR POC for this chart’s fixed range of 10 daily candles that i have selected. Be on the look out when/if VTHO closes successfully a daily candle above the VPFR POC.
VTHO is still under its VPVR POC for this chart’s visible range.
Volume is still relatively low on this Binance Chart and note that the last 5 daily Volume Bars have been below its Volume 20 period MA.
Note that VTHO is still in the Bearish Zone of the Ichimoku Cloud using the 20,60,120,30 settings. For the longterm, we need VTHO to keep heading upwards towards the Ichimoku Cloud Equilibrium Zone on this 1d timeframe.
Looking at the Moving Average Convergence Divergence (MACD) we can see that the MACD Line (Blue Line) is curving upwards and looks like it may cross back over the Signal Line (Orange Line) which would be a buy signal of varying degree because the MACD Lien (Blue Line) is still under the 0.0 Base Line in the Negative Zone on this 1d timeframe. Note that we have not had a MACD Green Histogram since 11th Nov 2021.
So long as VTHO stays above the LSMA, be on the look for a daily candle close back above the Bollinger Bands Middle Band Basis 20 Period SMA and successful retest as support. Also be on the look out for when/if the MACD Line (Blue Line) crosses back above the Signal Line (Orange Line) on this 1d timeframe creating a potential buy signal for traders who use the MACD indicator.
I hope this is helpful with your trading and hodl-ing.
Notes:
Symmetrical Triangle = Ascending & Descending Converging Black Lines on Chart
Descending Channel = Descending Parallel Black Lines on Chart
LSMA = Black Squiggly line on Chart
Bollinger Bands = Grey Bands on Chart
Volume Bars = Bars Bottom of Chart
Volume 20 MA = Orange Line going through Volume Bars on Chart
Ichimoku Cloud = Red and Green Cloud on Chart
VPFR POC = Short Horizontal Red Line on Chart
VPVR POC = Long Horizontal Red Line on Chart

VTHO/USDT breakout breakout happened to vtho/usdt in 2 hr time frame
descending triangle 🔽
can enter the trade
(or)
wait for retracement and take the entry
#dyor
