VTHOUSDT trade ideas

VeChain | Still a Good Crypto Worth Buying at This Low PriceVeChainThor public blockchain was launched with the goal of mass business adoption. The public blockchain has two tokens, VeChain and VeThor (VET) tokens. VeThor token is used to power transactions that take place on VeChain. The token is critical to the functionality of the blockchain. It is representative of the smart contract element of the network.
The unique nature of the token has drawn the attention of investors. It possesses a meta-transaction feature, which means users can carry out multiple transactions. The participants of the blockchain can essentially organize multi-task transactions and multi-party payments.
The blockchain is also open source and has a high processing speed, making it possible for developers to combine their efforts.
VeThor exhibits excellent versatility, which makes it attractive to many users. Participants at all levels can enjoy the different capabilities.
For transactions to be approved on VeChain, a VeThor token has to be created for each VeChain token introduced to the block. The current generation rate for the token is 0.000432 per day.
The rate can change only by increasing but not reducing, there are several ways you can earn the token.
One is by owning VeThor, the other methods include owning an authority node or an X economic node.
With insights into the token price, you will be able to identify whether it is safe to invest in the token. More so, you will know when the best time would be to buy or sell the tokens. Currently, the price of the token stands at $0.011313. Only two months are remaining of 2021, and changes are expected to take place.
Suppose you look at this in terms of profitability and growth. In that case, the token is undoubtedly worth investing in. As seen from the price forecasts, the token price has been increasing gradually over the months. The price is going to increase, and this is excellent news for the investors.
Apart from its outstanding features, the token's blockchain will increase in popularity with time due to its current low price. As use increases, the price will also increase. The other reason why the token may be worth your money is that its price is not expected to reduce, especially as it becomes more prevalent in logistics.
To better understand the performance of a token, market information is vital. This will go a long way in providing you with the extra information you need to determine if the token is a good investment.
Based on the above forecasts, the future of the token is bright. The price of the token has been increasing over the months, and especially in 2021. The token is projected to maintain the upward trend even in 2022 and the coming years.
The general price chart of the token also looks promising. It ranks 153 in market capitalization, which indicates the token is popular. The trading volume is also good, as it shows that the token is used often.
VTHO price at 0.011313 USD, based on our forecasts a long-term price increase is expected to be around +742.00%.
- Our option for #VTHO is TO BUY AND HOLD IT.
It’s important to keep in mind that cryptocurrency markets are extremely volatile, making it difficult to accurately predict what a coin’s price will be in a few hours or a few days and even harder to give long-term estimates. As such, analysts and online forecasting sites can get their predictions wrong. We recommend that you always do your own research and consider the latest market trends, news, technical and fundamental analysis , and expert opinion before making any investment decisions. Be patient and look long term wisely and never invest more than you can afford to lose.
Trading & Investing both are the master of RISK.
Please comment, like and follow if it was helpful for you.
Thank you for your time.
Have a profitable day.
| Review and analysis by Samadi.Finance |

VTHO updateVTHO is still within its Symmetrical Triangle on this 1d timeframe.
At the moment VTHO has found support from the Ascending Trend-line of the Symmetrical Triangle.
VTHO is below its Bollinger Bands Middle Band Basis 20 Period SMA, VTHO needs to get back above this level on this 1d timeframe.
At the moment VTHO is below its Least Squares Moving Average (LSMA) for this 1d timeframe. VTHO needs to close this daily candle above the LSMA because a close below the LSMA is is potential sell signal.
VTHO is below its Volume Profile Fixed Range Point of Control (VPFR POC) for the fixed range of 6x 1d candles that i have selected.
VTHO is also below its Volume Profile Visible Range Point of Control (VPVR POC) for this charts visible range.
Note that the last 6x Volume Bars have closed above its Volume 20 Period Moving Average.
If we look ate the Average Directional Index (ADX DI) we can see that Positive Momentum has dropped with the +DI (Green Line) dropping to 26.25 and Negative Momentum has increased wth the -DI (Red Line) rising to 19.26. Note that the +DI (Green Line) is still above the -DI (Red Line) on this 1d timeframe. The ADX (Orange Line) has also dropped to 25.69 and note it is still under its 9 Period EMA (White Line) which is at 27.29 for this 1d timeframe.
If we look at the Moving Average Convergence Divergence (MACD) we can see that the MCAD Line (Blue Line) is still i the Negative Zone of the MACD indicator. If you are waiting to go long but are uncertain then be on the look out for when the MACD Line (Blue Line) crosses back above the Signal Line (Orange Line) which is a buy signal of varying degree depending on if the MACD Line (Blue Line) is in the Positive or Negative Zone.
If we take a look at the Stochastic Indicator (Stoch) we can see that VTHO is now in the Oversold Zone of this indicator. Be on the lookout for when the %K Line (Blue Line) crosses back above the %D Line (Orange Line) with also the %K Line (Blue Line) crossing back over the 20 Line out of the Oversold Zone.
First port of call is that VTHO needs to close this daily candle within its Symmetrical Triangle, then VTHO needs to get back above its LSMA and Bollinger Bands Middle Band Basis to get back on track.
I hope this is helpful with your trading and hodl-ing.
Notes:
LSMA = Yellow Squiggly Line on Chart
Bollinger Bands = Grey Bands on Chart
VPVR POC = Long Horizontal Red Line on Chart
VPFR POC = Short Horizontal red Line on Chart
Volume MA = Orange Line going through Volume Bars on Chart
Symmetrical Triangle = Converging Ascending and Descending White Dashed Lines

vtho - brangelaBTCvtho s/r lines in. demand/supply zones in. sell volume higher than 14d volume average. waiting for it to dip to demand zone then buy. setting up TP at supply zone

VTHO - quick 1d chart updateVTHO has received a massive pump today.
VTHO had broke out of its 'adjusted' Symmetrical Triangle today but at the moment it has retraced back under it, a daily close ABOVE the Descending Trend-line of this Symmetrical Triangle and a successful retest as support will be a very good sign of things to come.
VTHO is above its Least Squares Moving Average (LSMA) for this 1d timeframe. A daily candle close ABOVE this indicator is considered a potential buy signal.
At the moment, VTHO is back above its Bollinger Bands Middle Band Basis 20 Period SMA for this 1d timeframe. A continued daily candle close ABOVE this level is crucial.
Note that the Bollinger Bands Upper and Lower Bands have expanded due to volatility and this volatility expansion is for positive momentum.
VTHO is back above its Volume Profile Visible Range Point of Control for this charts Visible Range.
VTHO is back above its Volume Profile Fixed Range Point of Control for the fixed range of 4 daily candles that i have selected.
Volume has increased on this Binance chart and note that yesterdays daily volume bar closed ABOVE its Volume 20 Period Moving Average.
I have added a Trend-Based Fib Extension as some potential targets. If you are long but uncertain, it might be best to wait for a successful daily candle close ABOVE the 0.382 TB Fib level
The Average Directional Index (ADX DI) is indicating Positive Momentum has increased and Negative Momentum has dropped with the +DI (Green Line) at 36.5 above its -DI (Red Line) which has dropped to 16.35. Note that the ADX (Yellow Line) is pointing upwards at 26.02. We can expect an even bigger move up if the ADX (Orange Line) crosses back above its 9 Period EMA (White Line) which is at 29.17 so long as the +DI (Green Line) is still ABOVE the -DI (Red Line) on this 1d timeframe.
The Moving Average Convergence Divergence (MACD) is indicating momentum is upwards at the moment. Note that the MACD Line (Blue Line) is pointing upwards & looking very likely to cross back over the Signal Line (Orange Line) creating new Green Bars very soon. VTHO will potentially receive a massive boost up if the MACD Line (Blue Line) crosses back ABOVE the Signal Line (Orange Line) and then back over and ABOVE the 0.0 Base Line which will take it into the Positive Zone.
After such a big move up today a pull back should not come as a surprise, so a close ABOVE the Symmetrical Triangle and the 0.382 Trend-Based Fib Extension level may or may not happen today but instead tomorrow or potentially latest during the week.
I hope this is helpful with your Trading and Hodl-ing.
Notes:
LSMA = Yellow Squiggly Line on Chart
Bollinger Bands = Grey Bands on Chart
VPVR POC = Long Horizontal Red Line on Chart
VPFR POC = Short Horizontal red Line on Chart
Volume MA = Orange Line going through Volume Bars on Chart
Symmetrical Triangle = Converging Ascending and Descending White Dashed Lines

VeThor Token (VTHO) Buy signalVeThor also has a change to recover soon
Buy signals in pics bellow
What is VeThor token VTHO?
The VTHO token stands for VeChainThor Energy and is also known as VeThor Energy. It is used to power transactions on VeChain and is equal to the cost of conducting transactions on its blockchain. ... For example, the VET blockchain allows Proof of Work (PoW) to be conducted for every transaction.

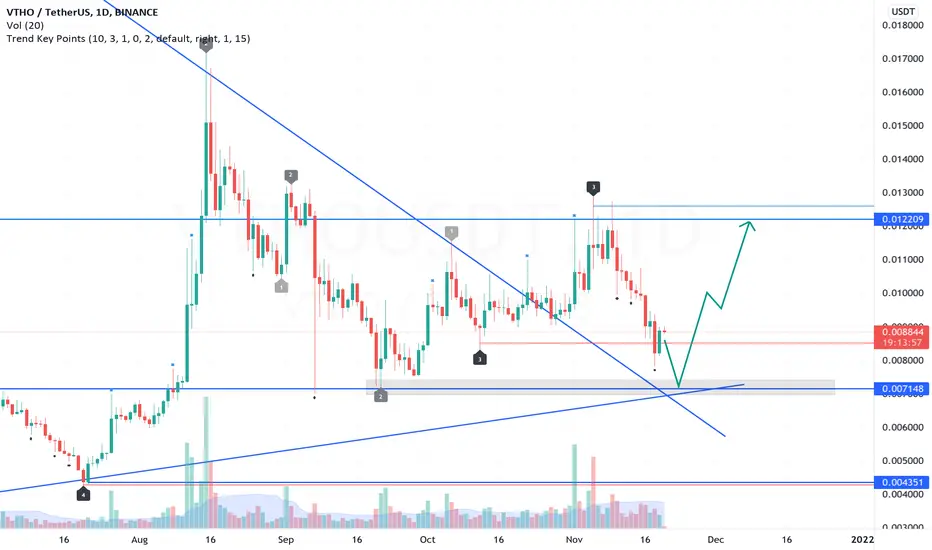
VTHO Daily AnalysisChart is obvious.
Potential buy zone: $0.007 - $0.0072, price action confirmation required
$0.01 is a potential resistance.
Trend Key Points Indicator have been used to draw important key levels and key points.
ready to popVET is breaking out above the strong resistance at $0.16, so i'm expecting baby bro VTHO to follow.
expecting extreme volatility over the coming weeks before the grand finale blow-off-top , so i would wait for the breakout and definitely use stops on this one. VTHO is about as volatile as they come.
VETHOR LONGMaking its first structure change & waiting for the price to break the trend for long run

VTHOUSDTIf the downtrend line is broken, we will have a VTHO pump. What do you think? It's true or not?


VTHOUSDT get out of the triangleVTHO is trying to get out of the triangle. It has also broken the descending komo cloud with a strong candle.

VTHOUSDT Out of the triangle, attack to buyVTHOUSDT Out of the triangle, attack to buy
target = 0.0168
target=0.0280
target 0.100

#vthousdti think...
longerrrrrrrr
I think this event on the chart shows a long at least one hundred percent

VTHO/USDTVTHO/USDT 4hr
VTHO/USDT : Waiting for Vtho to break the downtrend and Find support around the 0.01009 Area and hold.


VTHO 4h analysis - Entry ChangeEntry zone: $0.0090 - $0.0092
Stop loss: $0.0082
1st target: $0.0104
2nd target: $0.012
Trend Key Points Indicator have been used to draw important key levels and key points.


VTHO showing bullinsh strengthLet's keep and eye on that one.
Trendline breaking to the upside + MACD bulllish cross.
I will wait end of week to see what the final candle gives.
I have started laddering in.

VTHO - to Daily Trend ?VTHOUSDT - Triangle Pattern
The price has been moving inside a triangle.
We expect it to come out of the triangle and move to the daily trend as the first target.
But according to the type of triangle, we can expect the price to continue its trend until the second target.
But for this it is necessary to break the daily trend line .

Entry VTHO@ $0.010 Target@ $0.042 Nov 24, 2022 DelayVethor Token
Entry VTHO@ $0.010 Target@ $0.042 Nov 24, 2022 Consolidating
Entry VTHO@ $0.009 Target@ $0.042 Nov 24, 2022 Consolidating
Entry VTHO@ $0.008 Target@ $0.042 Apr 8, 2022
Entry VTHO@ $0.007 Target @ $0.042 Apr 8, 2022
Technical Analysis Conditions:
1. Break-out of Channel $0.029
2. Pull-back toward $0.005
3. Channel Run to $0.017
4. Price consolidating low balling $0.007
5. Ideal Entry @ $0.08
6. Target @ $0.042 to $0. 05
Fundamental Descriptions:
Built on top of the VeChainThor public blockchain, the VeChain ecosystem
provides the best resources to anyone who wants to solve real world economic.
The public blockchain that derives its value from activities created by members
within the ecosystem solving real world economic problems
Project website: www.vechain.org
Binance. Us Exchange: www.binance.us

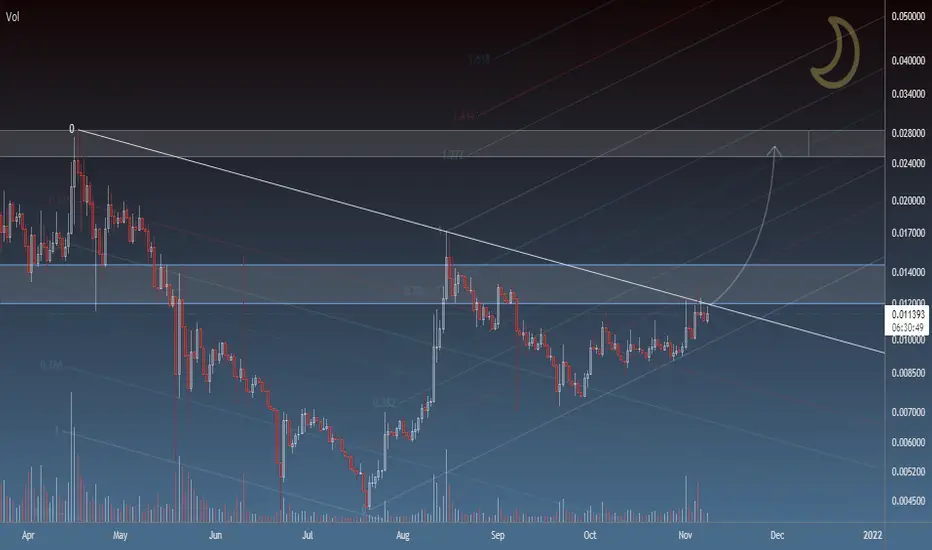
VTHO ab=cd pattern 80% increase#VTHOUSDT
$VTHO broke out from a long term descending resistance and confirmed it as support. price stayed above an ascending support line . if price hold this support, short term resistances are around $0.011 and $0.012. if #VTHO going up to touch $0.017 and $0.018 the AB=CD pattern will complete.

