But no one's looking! WANBTC double bottom?!Recently Wanchain has fallen out of the Top 100 on CMC, some people may never check page 2...not everyone is as saavy as you! (HINT: This is in our favor)
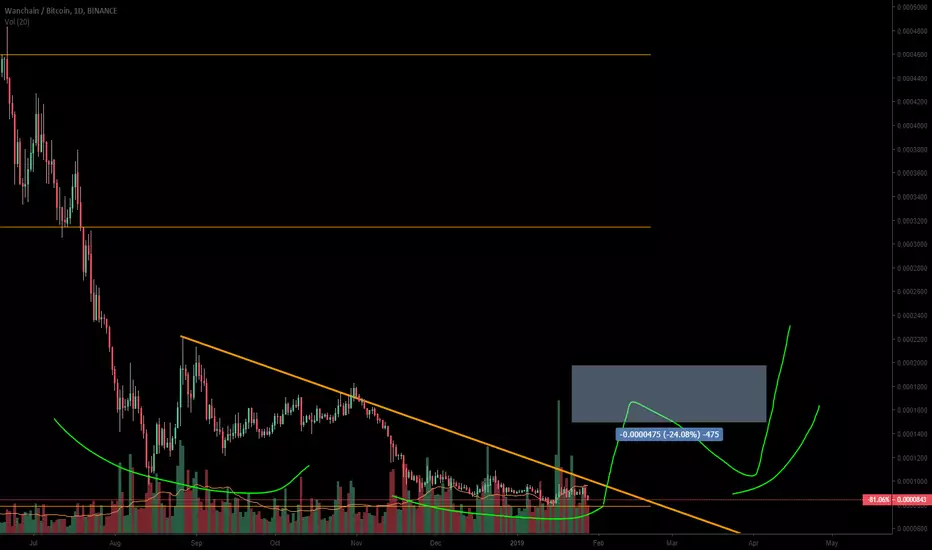
On the Daily Time-frame for BINANCE:WANBTC there's a huge bullish engulfing candle with massive volume found inside yellow ellipse.
Then we find it retraces back to, holds and bounces from that same close/open...Double Bottom possibility.
This entry looks like a dream come true, but will it make dreams come true?
Stack IT, Flip IT and Reverse IT
WANBTC trade ideas

WAN – only 1 condition. 1300% profit possible – long-termHi Traders!
Today we have another interesting idea for you to share.
One of our followers also asked us to prepare such an analysis.
So here is it comes.
Technical analysis details :
• Since a couple of months, we can observe higher volumes
It means one thing – accumulation .
• We are very close to the lowest levels in history
This makes the price attractive .
• Still, no momentum to go up
We advise waiting till we cross at least EMA50.
• WBM BUY/SELL Indicator – not here yet. Still, there is room for a lower price .
This is short term-prediction showing the best time to buy
• Weis Waves – The supply is decreasing. All we need is more demand now.
• Great long-term potential profit – 1300%
• Set your stop-loss at around 0.0000680 or 5-10% below the price your buy
So this one single one condition is:
We have to break up the last peak and maintain above the level of 0.0000845.
Don’t buy below this level .
Good luck.
This is a good project with active and engaged employees .
Recently they delivered Wanchan 3.0
“This launch finalized the cross-chain integration with Bitcoin, bridging the Bitcoin community to the Ethereum community. Wanchain 3.0 also added cross-chain ERC20 tokens including MakerDAO's DAI and MKR and Loopring's LRC.”
Thank you for reading and your time .
Massive Hugs!
Don’t forget to join us at Telegram .
WBM Team

WAN-BTC Long Trade PlanCommodity : WAN CHAIN
Trade Type : LONG
Trading Against : BITCOIN
Entries : Double-UP Entries throughout the Buy Zone
Profit Taking : 25% at each TP point
Profit Locking : Move SL to break even once TP1 is hit, to TP1 once TP2 hits, to TP2 once TP3 hits and so on
Duration - 1-2 weeks
Investment in trade : 10% of the total Trading Balance.
Prospective Profit : 5.6% to 22.5%
Prospective Loss : 3.7%
RRR : SL to TP1 is 1.54, SL to TP2 is 2.89, SL to TP3 is 4.32 and SL to TP4 is 6.11
Buy Zone/TPs/SL price points are marked in the chart as follows
Greens - Profit Targets (TPs)
Blue - Buy Zone (Entries)
Red - Stop Loss (SL)


WANBTC / Trend Analysis / 09.02.2019We've double bottom for aggressive traders. We can also buy the breakout.


Wanchain (WANBTC) Bullish Engulfing (Learning)Here is one of the easiest to spot signals when it comes to candlestick reading, as well as a very accurate one.
Signals coming from the charts can get invalidated, meaning, you can have a signal that points to a change of trend and later the trend remains the same. For this reason, when trading we always use a stop loss.
Here we have what is called a "bullish engulfing" candlestick pattern. This happens when a bullish candle completely covers the bearish candle before it.
Marked light blue on the chart, you can see this pattern. The red/bearish candle, and the green/bullish candle which completely covers the bearish one before it.
On top of this pattern we also have a nice increase in volume (green volume bar below the last candlestick), as well as a break above EMA10.
(Looking for additional signals that support your main signal is always good as your analysis will have more strength).
Now, this is the daily time frame, so we have to wait for the daily candle to close before this signal is complete and valid.
If you trade based on this formation, your stop loss can be placed right below the low of the bullish candle.
Looking back on Wanchain (WANBTC) price action, you can see that volume has been increasing a lot lately, this is another signal that a move up is approaching.
Note: This is not a piece of trade advice. This information is shared for learning and entertainment purposes only.
All of my trades are clearly marked and contain buy in price range, targets, stop loss and additional details.
Hit LIKE if you enjoyed this post.
Namaste.

$WAN trade ideai'm not basing my trade only on RSI divergence but this one is convergent with this support, let see how it'll react to that support

Trading Wanchain using Harmonic Pattern GARTLEY - Long Trading Wanchain using Harmonic Pattern GARTLEY - Long

WAN - Potential Prime Big picture opportunity - 1D Inv H&SHi Everyone,
To me it appears that WAN might be forming the head of an inverse head and shoulders on the daily chart.
In this case, if you purchase in this range or even if it goes a bit lower, you'll be potentially purchasing at the lowest satoshi value that it will go to if this reversal pattern plays out.
Once the head is complete, WAN could make a big move up first, to maybe around 1500 sats - 2200 sats, I'd personally expect to sell between 1500-the upper 1900's in sats before it goes back down and forms the other shoulder to this potential Daily chart inverse head and shoulders.
Anyway, please take a look and see what you think!
Not intended as financial advice nor is this concerned with a zoomed in day trading picture.
Thank you everyone!

Daily Bullish Signal $WAN #WAN (28 Jan 2019)PINK ARROW indicates
BLUE ARROW indicates the EXPECTED Time and Targets
Level Stoploss point up to maximize profit and reduce risk
I'm working all the time, even in Bearish Market

WAN - INVERSE H & S Reversal PatternWAN seems to be forming a potential inverse head and shoulders pattern. Target for pattern is ~1140/50 sats ~ 25/30% ROI. Volume profile checks out, good chance it'll be valid if btc continues sideways/goes up. Stop loss at 830. GL

WAN/BTC first it will dump then it will pump follow me on twitter:https://twitter.com/SyedYou22272641
join my telegram channel
t.me

WAN fake break down to 850 - buy zoneThe daily spread become more tight, indication of bigger move incoming. I would love to see the break down to 850 buy zone. And than easy 12% trade from there.


24.1.2019 Wanchain 1D Hey Guys,
Buy: wait for double bottom confirmation. And for better entry.
Take profit: Supply Zone

WANCHAIN BULLISH AB=CD HARMONICWANCHAIN FORMED BULLISH HARMONIC PATTERN AB=CD
Watch target 990-1010 sats

WAN descending channel breakout comingBreakout from descending channel should happen soon. I'm seeing downward movement coming, but here's potential outcomes for both.
As always, these are just ideas. Best of luck in your trades!

