The MACD & RSI Gives Away The Bullish WaveWe joined early on this bullish 'Wave'.
WAVESBTC is now moving above EMA100 daily, which is a very strong bullish signal.
This signal becomes even stronger when you notice how yesterday candle is bearish but fully negated today.
( Candle closure needed for confirmation. )
The MACD and RSI is what gives it away.
We continue aiming higher...
Patience is key.
Namaste.
WAVESBTC trade ideas

WAVES/BTC next steps Expecting around a 10% drop as shown in the chart, before a bounce back close to the current price and then the final puke. GL

Waves vs Bitcoin | Highest Volume Since May '21Waves isn't stopping.
We have the highest volume on a weekly candle since May 2021.
The bullish wave for WAVESBTC started last year in January and went for 470%, this year it starts in February, we can see similar results.
We have a higher low, so a higher high can put us at 450%... We already have over 100% growth from the last low.
See additional details on the chart.
Previous trade ideas:
Thanks for the support.
Namaste.

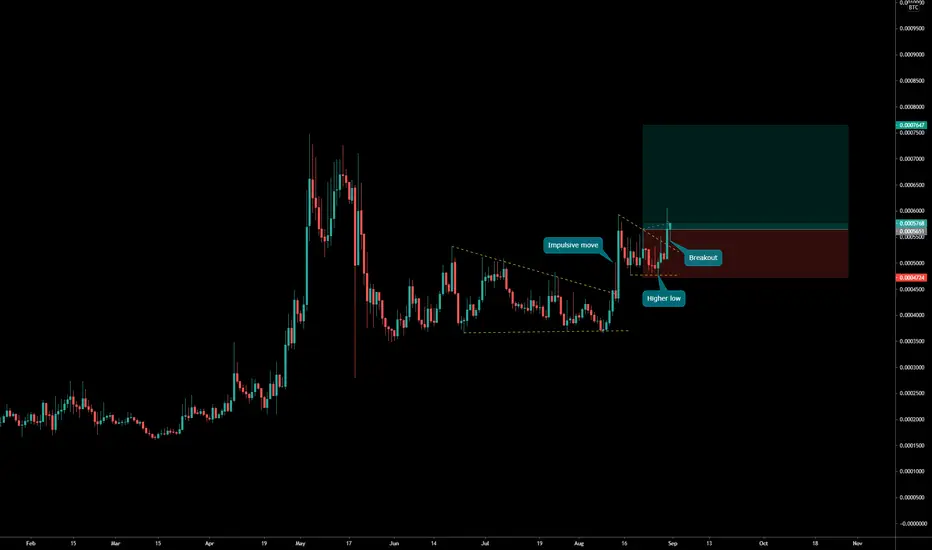
WAVESBTC had a breakout from the bear flagThe price is creating a descending channel on the daily timeframe.
On 4h timeframe the price created a bearflag between the weekly structures, and after the breakout down, the market retested the previous support as new resistance.
how to approach?
If the price is going to have a breakdown from the weekly support, we can add in our watchlist and wait for apply our rules,
–––––
Follow the Shrimp 🦐
Keep in mind.
🟣 Purple structure -> Monthly structure.
🔴 Red structure -> Weekly structure.
🔵 Blue structure -> Daily structure.
🟡 Yellow structure -> 4h structure.

WAVESBTC is testing the daily resistanceWAVESBTC is testing the daily resistance after the price had a breakout from the descending dynamic resistance
IF the price is going to have a breakout, According to Plancton's strategy (check our Academy ), we can set a nice order
–––––
Follow the Shrimp 🦐
Keep in mind.
🟣 Purple structure -> Monthly structure.
🔴 Red structure -> Weekly structure.
🔵 Blue structure -> Daily structure.
🟡 Yellow structure -> 4h structure.
⚫️ Black structure -> <4h structure.
Waves Falling Wedge Pattern (150%+ Potential Target)WAVESBTC just breaking out of a falling wedge, a bullish pattern.
I had some doubts earlier but it is looking better now.
WAVESBTC now trading above EMA10/EMA21.
Strong RSI while the MACD is trending up and about to enter the bullish zone.
Multiple bullish signals are telling us that this pair is ready to grow.
The targets are mapped on the chart with Fibs.
Enjoy.
Namaste.

Waves to UptrendYesterday Waves/BTC broke out of it's 2 months downtrend, following Waves/USD pair. Today passed the tough resistance at 0.00038 and at the moment now shows signs of life and strength.
Next resistance is around 0.0004, and after some correction, it should climb up to 0.000485.

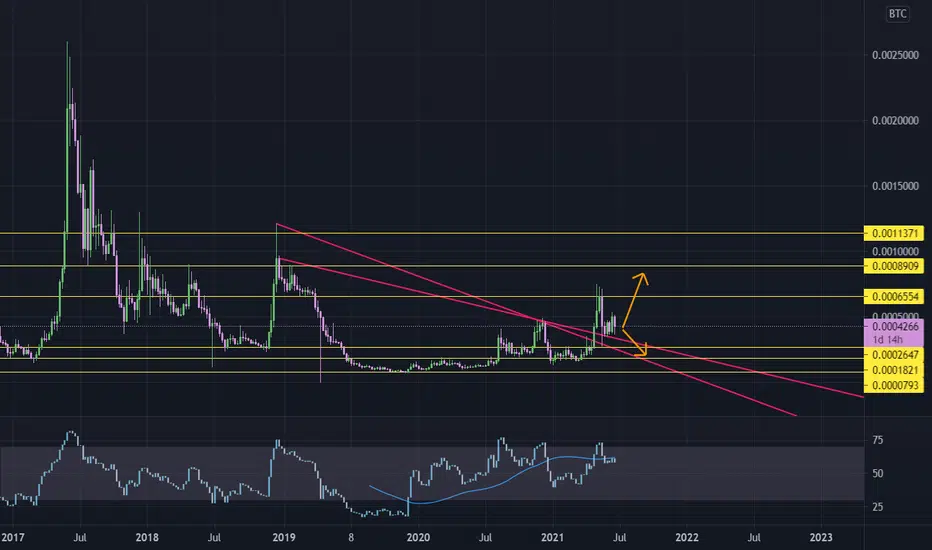
WAVES AnalysisThe USD pair shows two different possible outcomes
A break of the large trend line due to a double top (Bear)
Or a bullflag that pushes price higher
To discern the difference we look at the BTC chart and see that it is in favor of the bulls, hence we can draw the conclusion that the bullflag must be dominant, and the USD chart is in the bulls favor.

Huge Bullish Divergence I've been having Waves under my radar for quiete a while and the bullish Divergence I see on 4H is just undeniable. I think we are going to see a serious performance in both Waves/BTC and Waves/USD pairs soon.


$WAVES, last important level prior YTD highs..$WAVES
Another one trying to hold/flip the last important level prior YTD highs..
Set alerts just in case =)
#WAVES

WAVES will go 50% faster than BTCSince BTC dominance is at about 42%, below 45% is considered alt season.
After 50.4k for BTC Waves will see its price action going up around 50% faster than BTC according to the chart. Up to the $40 mark (32% raise from $30.30 today's price).
This will also put BTC is around 57k.
The good news is Twitter accepting now BTC.
Let's see,
Happy trading

WAVESBTC is testing the weekly resistance WAVESBTC is testing the weekly resistance after a breakout from the triangle. The price is testing the the 0.618 Fibonacci level. IF the price is going to have a breakout from the weekly resistance, According to Plancton's strategy (check our Academy), we can set a nice order
–––––
Follow the Shrimp 🦐
Keep in mind.
🟣 Purple structure -> Monthly structure.
🔴 Red structure -> Weekly structure.
🔵 Blue structure -> Daily structure.
🟡 Yellow structure -> 4h structure.
⚫️ Black structure -> <4h structure.
Here is the Plancton0618 technical analysis, please comment below if you have any question.
The ENTRY in the market will be taken only if the condition of the Plancton0618 strategy will trigger.

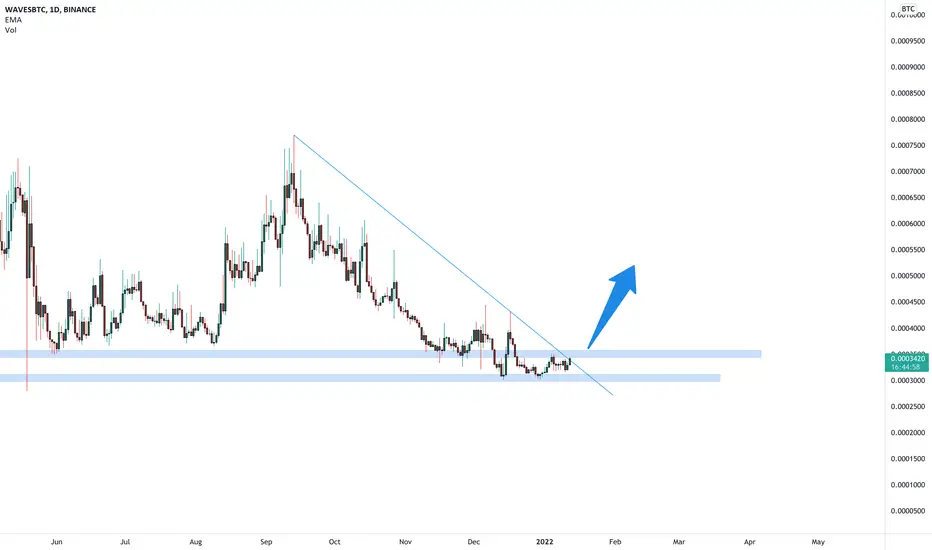
WAVES/BTC buy opportunityHi followers,
BINANCE:WAVESBTC formed very nice flag continuation pattern, which developed after an impulsive move up,
The expectations are for another impulsive move up.
Don't forget to manage your risk! 👌
Good luck and trade with care 🙏
If you like my content - 👍 Like, 💬 comment, 👆 follow and 👉 share!
❗❗❗
Disclaimer: This information is not a recommendation to BUY or SELL. It is to be used for educational purposes only!
5x your BTC with WAVES! WOW!This weekly chart looks bullish AF!
Waves rarely disappoints. Check the USD chart. It just goes up!
VERY BULLISH!


WAVESBTC TO BOUNCE OFF THIS LEVEL?From our last analysis on WAVES, we're 150% up on the longs we took using x10 leverage.
Now price has broken above a key level inside this ascending channel, so we need to watch carefully for a bounce above the level.
If the area holds, then expect the highs of the ascending channel to be met.

WAVEUSDT TO THE TOP OF ITS ASCENDING CHANNEL?It is without question that this is an ascending channel.
We have seen price move along this channel for quite some time.
Price has successfully traded to the bottom of the ascending channel.
Would we go back to the top? The current candlesticks are indicating bullish sentiments and could set off for the highs soon.

WAVES/BTC to double?I'm a true WAVES bull. I think the stock has performed incredibly well this year and it has held up relatively strongly during the correction. What we see here is a proper cup and handle setup, with line b' as the target price. We did have a breakout in April, but we are now forming a new congestion zone just below resistance at line c'. Every time weakness occurs, we see buyers coming to the rescue. I buy on any dips.
Where will WAVES be at the end of the year? I think we are looking at a five-bagger, possibly a ten-bagger. At the ratio around line a' or b', we would probably see a six digit Bitcoin price. That would put WAVES at a minimum of $90 at the end of Q4. I'm happy to be reminded of this at the end of the year.

$WAVES, Looking good if it can hold/flip this level..$WAVES
1D UCTS buy confirmed...
Let see if it can hold/flip & push from here into new highs..
#WAVES

WAVESBTC mixed signals#WAVESBTC
supports and resistances of price show an uptrend move, but RSI is below HMA
so maybe there would be another leg down.
WAVESBTC is testing the 0.786 🦐WAVESBTC is testing the 0.786 and the support of the triangle below the weekly resistance. IF the price will have a breakout and retest the weekly resistance as new support, According to Plancton's strategy (check our Academy), we can set a nice order
–––––
Follow the Shrimp 🦐
Keep in mind.
🟣 Purple structure -> Monthly structure.
🔴 Red structure -> Weekly structure.
🔵 Blue structure -> Daily structure.
🟡 Yellow structure -> 4h structure.
⚫️ Black structure -> <4h structure.
Here is the Plancton0618 technical analysis, please comment below if you have any question.
The ENTRY in the market will be taken only if the condition of the Plancton0618 strategy will trigger.
