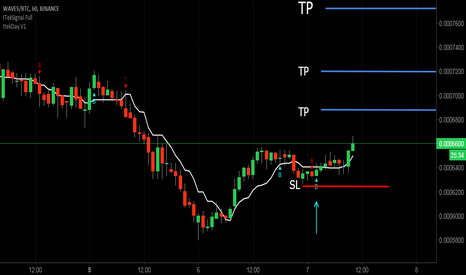
WAVES is going upLong term trend line confirms support on the 3-day chart, that is powerful. RSI & Stochastic patterns also change direction. Targets indicated. You can wait until bottoming low turns to the support, i.e. bounce off bottom blue horizontal line.Longby without_worriesUpdated 5
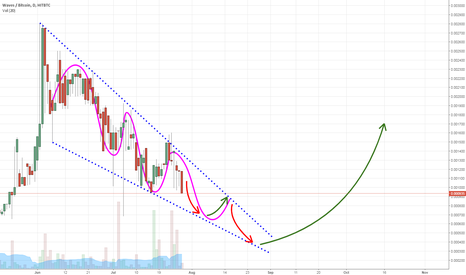
Waves falling wedge, double bottom in play! Hi everyone, Waves looks now that downtrend not end yet here, we are in falling wedge and maybe go for double bottom around 24000sat-25000sat, this is buy range for me. if we come here. Stochastic looks not good here. Is possible that we break falling wedge sooner, so after that this trade is not active for me. I am waiting for 25000sat. Then I am opening long on Waves. Targets and stoploss after we reached buy range. I will be update it. Thank you for likes, comments and follow, dont forget :) Longby crypToucheUpdated 5513
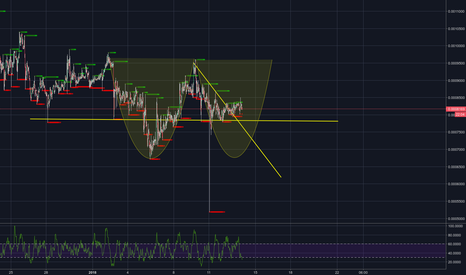
WAVESBTC a nice Double BottomAt the 2-hours timeframe chart we can see a partially formed Double bottom pattern. According to the Technical Analysis there should be a reverse soon in the short term. Stoch RSI is in the oversold zone, Momentum is Bullish while SMA and EMA are going to indicate "Buy state" soon. The possibility of the second bottom to be formed is high, thus the pattern will be finished. Technical analysis is positive at the moment we can see a rise to the 0.000274 level soon where our free target is located. Up from this point the price can be pumped which will help it to penetrate Ichimoku clouds. Nevertheless then we will see a volume contraction and subsequent corrective price movement.WLongby SkyrexioUpdated 6
$WAVES Has Bullish Divergence With RSI In Oversold TerritoryLooking very promising. The 12 hour chart shows bullish divergence with RSI in oversold territory, confirmed on multiple time frames. Price bounced off of the bottom of the descending wedge, and is finding support on a major daily level.Wby ScottMelker7
Waves - Time to buyWaves broke out of a falling wedge. It is pulling back now and formed bullish divergence on the weekly. Nice time to average in. Buy & sell positions in our crypto signal scanner (comment). by aliameyUpdated 1
WAVES BTC H4 BINANCE UP TO 70% UPSIDE INCOMINGWAVES BTC H4 BINANCE UP TO 70% UPSIDE INCOMING. LOOK TO BUY DIPS SOON.WLongby asgcorpUpdated 12
WAVESBTC ONE MORE LEG DOWN?Hello guys! Looking at Waves it seem to be on a corrective structure ABC of Wave 4. Once this structure is finished Waves could go down @ around 0.00018101 area or even lower @ around 0.00014000 area between 60-100% lower than it is now. After this completion We most probably see Waves making new all time highs. I would update the charts as soon as the market makes a decision. More deep analysis coming your way of all major and popular Cryptos! Please share, comment and like!by DecentralizedTraders5
WAVESBTC [Daily] More weakness coming....For now looks like we have had two corerective waves up and more weakness is coming. To invalidate bearish scenario close above 0,00045 is neededWShortby CryptoMarketFlow3
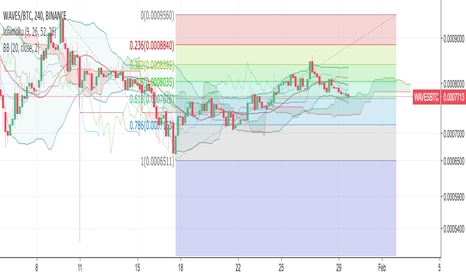
WAVESBTCLast time WAVES hit stop loss, but let's try again. This time idea is to enter near the channel bottom with stop loss a little bit bellow (I'm OK with 3% loss) and target at 0.382 Fib retracement level. I won't close the whole trade here, if conditions will be good - "spare" target is at next Fib level. If it won't drop to channel low, I'm willing to enter with smaller mount on breakout at 31k8 and the same targets for start. Disclaimer: this idea is solely for my own purposes, to satisfy the ego, if it will work out ;) Longby rludvikUpdated 222
Waves, LONG!it's exactly the the same time / RSI pattern and the triangle will reach the end very soon. the pump should start in the next 8 hours,or in a few days, it depend which triangle the chart will follow. target:0,00048 btc ( within the next days) good luckLongby Cryptonerd20152
WavesBTCStoch is very low at 1D timeframe and price is at BUYSUPORT, bull divergence soon BINANCE:WAVESBTC BUYZONE 1 0.00031-0.00032 Sell Target T1 0.00034 T2 0.000363 T3 0.000405 BUYZONE 2 0.00029-0.000295 Sell Target T0 0.000312 T1 0.00034 T3 0.000405WLongby CryptoRomaniaTDUpdated 8
WAVES/BTC - Let's ride the wavesRisk : High, Early entry Coin: WAVES/BTC Exchange: Binance Entry Zone: 0.000317 or 0.000325 Target 1 : 0.000348 (9%) Target 2 : 0.000375 (17%) Target 3 : 0.000415 (34%) Stop Loss: 0.000287 (10%) Comment : Symetrical triangle pattern Strong support and consolidationWShortby TCCSAcademy2
Wave some more time required before it makes a move. $waves Good time to accumulate one of the best crypto project around.Wby Tradingshiksha2
Waves, High Return With Low Risk! LONGIt's very simple, just look at the chart. - triangle breakout or down is imminent! open a long(buy) position between ~0.000315 and ~0.00034 (it depends on the current course of the chart) you can also buy the breakout. stop loss as described. good luck and best wishesLongby Cryptonerd20151
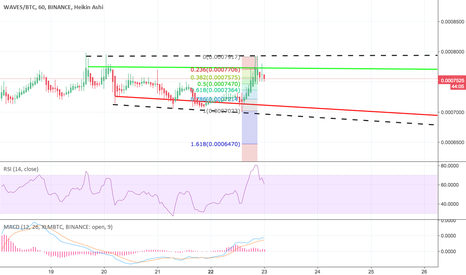
WAVESBTCI did some profit on last trade, let's try again with WAVES. Idea is to enter at bottom of Fib channel again with stop loss bellow previous lows and two targets - the first one corresponds to short term resistance and the second one on 0.618 Fib channel level. Disclaimer: this idea is solely for my own purposes, to satisfy the ego, if it will work out ;)Longby rludvikUpdated 2