WAVES/USDT BREAK 3.0There is good chance for wave break and focus goes there to check it in the coming time frames.
Related pairs
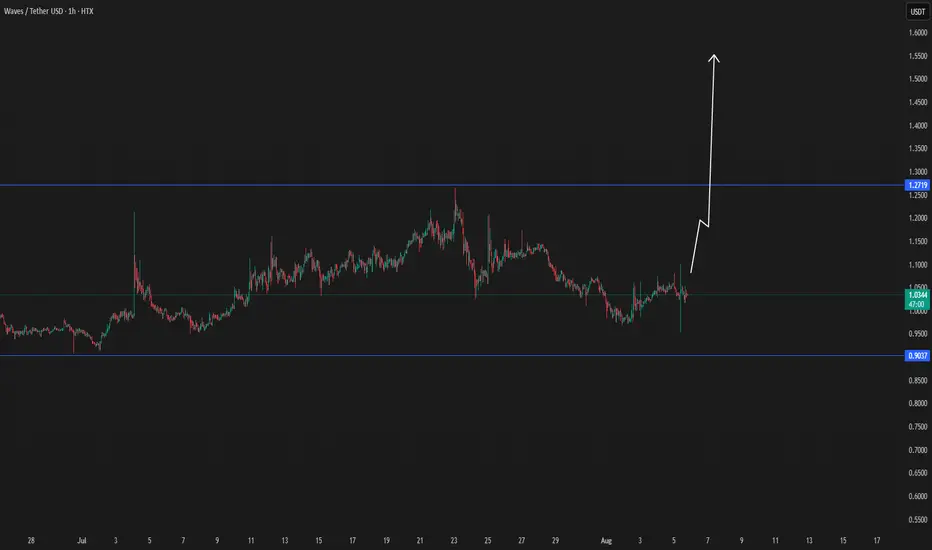
WAVES ON WAY TO $2waves have a high chance to enter a new break to 2 usd, since the last data.
When there is more confirmation, the updates will be below.

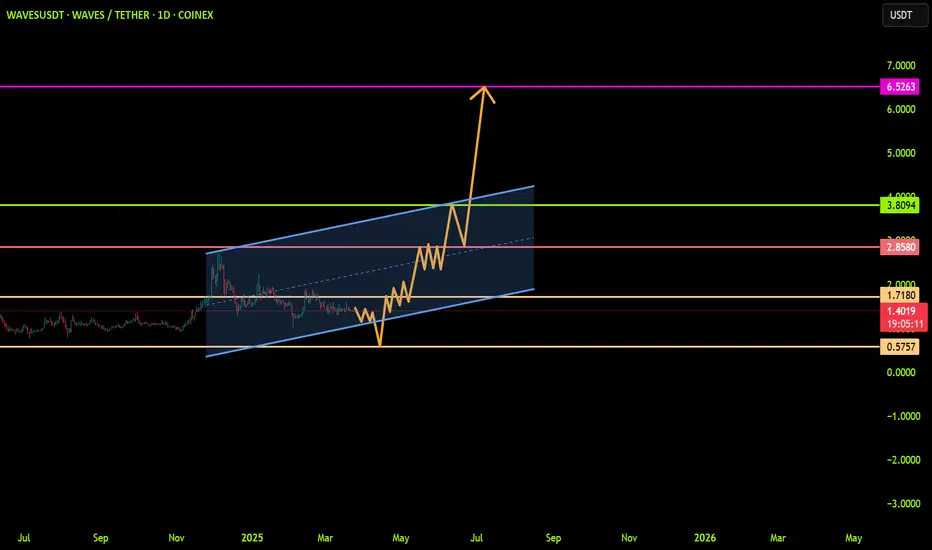
WAVESUSDT - Upward Target LevelsListed a few bull targets once this breakout of the falling wedge pattern occurs
Hopefully these levels are reached and the previous ATH is eclipsed
Falling wedge is a bullish pattern, lets see where it goes
Weekly chart

WAVES Falling WedgeA falling wedge pattern during the bear market
This is a bullish pattern suggesting a breakout once completed
Very cheap right now for WAVES
Chart pattern analyses on this Daily timeframe

WAVESUSDT: Trend in daily time framePlease pay special attention to the very accurate trend, and colored levels.
Its a very sensitive setup, please be careful.
BEST,
MT
Long Entry on WAVESUSDT with PSAR Stop LossBased on the daily chart for WAVESUSDT on Bybit, we've identified a bullish setup for a long entry:
Indicators Used:
MLR (Moving Regression Line) in blue
SMA (Simple Moving Average) in pink
BB Center Line (Bollinger Bands Center Line) in orange
PSAR (Parabolic SAR) in black dots
200-period SMA in

wave ready to up1. break out daily trend and complete pullback.
2. daily vol increase.
tp1 = 2.45
tp2 = 3.5


WAVESUSDTI'll wait for this currency to reach the buy zone and buy it... Target and stop are clearly shown in the image.
Good luck
KUCOIN:WAVESUSDT

Waves Looking Ready To Move (66%, 273% & 484% Short-Term)We already have a long-term chart for Waves, but it came to mind recently so here it is again. Why it came to my mind or how, I don't know... So, let's focus on the chart.
Here we can notice a recent bullish breakout above several moving averages. The orange one stands for EMA233, this is a long on

See all ideas
Summarizing what the indicators are suggesting.
Oscillators
Neutral
SellBuy
Strong sellStrong buy
Strong sellSellNeutralBuyStrong buy
Oscillators
Neutral
SellBuy
Strong sellStrong buy
Strong sellSellNeutralBuyStrong buy
Summary
Neutral
SellBuy
Strong sellStrong buy
Strong sellSellNeutralBuyStrong buy
Summary
Neutral
SellBuy
Strong sellStrong buy
Strong sellSellNeutralBuyStrong buy
Summary
Neutral
SellBuy
Strong sellStrong buy
Strong sellSellNeutralBuyStrong buy
Moving Averages
Neutral
SellBuy
Strong sellStrong buy
Strong sellSellNeutralBuyStrong buy
Moving Averages
Neutral
SellBuy
Strong sellStrong buy
Strong sellSellNeutralBuyStrong buy
Displays a symbol's price movements over previous years to identify recurring trends.
Frequently Asked Questions
The current price of WAVESUSDT SPOT (WAVES) is 1.041 USDT — it has fallen −1.32% in the past 24 hours. Try placing this info into the context by checking out what coins are also gaining and losing at the moment and seeing WAVES price chart.
WAVESUSDT SPOT price has fallen by −3.41% over the last week, its month performance shows a 4.28% increase, and as for the last year, WAVESUSDT SPOT has increased by 5.25%. See more dynamics on WAVES price chart.
Keep track of coins' changes with our Crypto Coins Heatmap.
Keep track of coins' changes with our Crypto Coins Heatmap.
WAVESUSDT SPOT (WAVES) reached its highest price on Mar 31, 2022 — it amounted to 63.500 USDT. Find more insights on the WAVES price chart.
See the list of crypto gainers and choose what best fits your strategy.
See the list of crypto gainers and choose what best fits your strategy.
WAVESUSDT SPOT (WAVES) reached the lowest price of 0.010 USDT on Jan 31, 2023. View more WAVESUSDT SPOT dynamics on the price chart.
See the list of crypto losers to find unexpected opportunities.
See the list of crypto losers to find unexpected opportunities.
The safest choice when buying WAVES is to go to a well-known crypto exchange. Some of the popular names are Binance, Coinbase, Kraken. But you'll have to find a reliable broker and create an account first. You can trade WAVES right from TradingView charts — just choose a broker and connect to your account.
Crypto markets are famous for their volatility, so one should study all the available stats before adding crypto assets to their portfolio. Very often it's technical analysis that comes in handy. We prepared technical ratings for WAVESUSDT SPOT (WAVES): today its technical analysis shows the sell signal, and according to the 1 week rating WAVES shows the sell signal. And you'd better dig deeper and study 1 month rating too — it's sell. Find inspiration in WAVESUSDT SPOT trading ideas and keep track of what's moving crypto markets with our crypto news feed.
WAVESUSDT SPOT (WAVES) is just as reliable as any other crypto asset — this corner of the world market is highly volatile. Today, for instance, WAVESUSDT SPOT is estimated as 6.78% volatile. The only thing it means is that you must prepare and examine all available information before making a decision. And if you're not sure about WAVESUSDT SPOT, you can find more inspiration in our curated watchlists.
You can discuss WAVESUSDT SPOT (WAVES) with other users in our public chats, Minds or in the comments to Ideas.