WAVESUSDT trade ideas

WAVESUSDTPERPETUAL FUTURES There is an observed break to the topside of a descending triangle on the 5 min time frame. This is followed by a pullback to a downtrend line. Bullish momentum is nit fully dissolved, as a slight uptrend is also noticed. Possible reversal to the 31.433 target is in play, before any other moved downward. Setup shown below.
NFA, just my own insight on this, correct me in the comment section if you notice anything otherwise.
BINANCE:WAVESUSDTPERP

WAVES /USDTAs you can see now WAVES is in this pattern in H 1 so just keep eye on it for making it short or long
My analysis it's for short term and even a day or hours don't use it for holding or long term
Just take advantage of the market and GO WITH PROFIT HAHAH
I hope you guys know how to set up your ST and Take profit for both long or short just wait for the breakout
Our targets for short or long are the green and red lines
This is not financial advice it's just my personal opinion
DO NOT FORGET TO USE STOP LOSS
Guys if you find my analysis useful DO NOT FORGET TO LIKE AND FOLLOW

WAVESUSDT - 25 March 2022In my opinion, the price is on a downward trend and can correct up to about $ 25
This is my personal opinion. Please do not trade based on my analysis and data.

🆓Waves (WAVES) Mar-24 #WAVES $WAVES
WAVES has been growing too strongly since the end of February. It is currently being rejected at the $34 zone and it can correct to the $24 zone before rising back to the $34 zone to retest this zone. With the current market strength, in the near future WAVES can break the $34 zone and continue to rise to the $44 zone. But if it loses the $24 zone then it will indeed reverse the downtrend and it will fall hard at least to the $18 zone.
📈RED PLAN
♻️Condition : If 1-Day closes ABOVE 24$ zone
🔴Buy : 24
🔴Sell : 34 - 44
📉BLUE PLAN
♻️Condition : If 1-Day closes BELOW 24$ zone
🔵Sell : 24
🔵Buy : 18
❓Details
📈Red Arrow : Main Direction as RED PLAN
📉Blue Arrow : Back-Up Direction as BLUE PLAN
🟩Green zone : Support zone as BUY section
🟥Red zone : Resistance zone as SELL section

WAVES slowing downLooks like the winds are changing. I caught a small initial short but got stopped out overnight when the first dump retraced, stop was set in a profit range so not the end of the world.
Currently looks like we're retesting the 31.6 S/R. New lows below the short dotted white line would be my confirmation that this run is over. Would love to see the RSI bounce off of .5 again as well.
If the top is in and we see a .382-.5 retracement, target prices could be 24-21. Pretty good short potential with a stop-loss at current 31.6 S/R, gives an R of 4.31 which could be adjusted to be much bigger if this thing manages to truly fall off a cliff for an even bigger retracement.

WAVES/USDT 2 possible short scenariosEverything is stated on the chart.
Hoping for a swing fail on previous highs to enter a high probability short after the deviation.
Don't forget to take profits on the way down.

$WAVESUSDT UPDATE!!!Hi Snipers,
Please refer to the recording for the next price levels and scenarios.
Thanks
MS

Wavesusdt will have correction?Currently price is at weekly resistance and i expect to price go down .

Waves It's time to ShortIn Daily time frame we can see that Waves is over brought and Volume is also decreasing. Waves need to test Again 30$ Before Breaking its strong resistance at 35.
I'm taking Entry and close it on 30 $
Have a Safe Trade

WAVES / USDTwe try to provide analyzes with a specific time area.
Please note the expiration time.
always Be faithful to the SL.
*(( If you make an emotional decision, do not use any analysis. Try to control your emotions and manage your asset ))*

Waves-How you can t see this? HUGE HEAD AND SHOULDERSWavesUSDT now formed a big head and shoulders pattern which is bearish and if we will close here, a breakdown is iminent.
MACD soon will go down.
Stochastic just crossed bear=pointing down
RSI yellow line just crossed above which is another bearish sign
Huge bearish divergence on 2 Days Timeframe

WAVES/USDT ChartHi, I try to post often so if you could follow and like it would mean a lot to me.
WAVES had a great run but I think that for now a short might be the best position to take. The coin has a bearish divergence in the 4H chart and in the 1D chart. In the 1D chart the RSI of the coin shows that the market is overvalued so that's another bearish factor. Volume is also seeing strong rejections that indicates a selling pressure coming in. WAVES also had 3 invalidations at 35$ price.
I stream weekly on TradingView, and my next stream is on friday at 3 pm UK time. I will be answering all your questions and talking about the market (like I did on my last streams). Be there!

Waves to 41 before heading back towards 12 Long than ShortI think waves is gonna push higher after closing at the highest level on a weekly. Id like to see us have a big sell off after we hit 41 and ultimately lose our $30 support followed by our support in the low 20's. I will be shorting any break towards 41 and be looking to take profits towards 12 unless we can hold the 20 or 30 level. Not financial advice. GL to all.


Waves 2021 Support Activated (275% Profits Potential)The same level activated in February 2021 on the WAVESUSDT chart is being activated again this year.
Back in 2021, when WAVESUSDT hit the support level marked in light blue, what followed was a strong 440%+ bullish wave.
Right now we have a similar pattern which can lead to nice gains.
See the chart... We are aiming at 88% with up to 275% on the next bullish wave.
This is not financial advice.
Namaste.

Accept 3drive Waves and ready for shortWaves after big rally , to being accept rsi divergence and start for short position…

WAVESUSDT WILL GO UNDER CORRECTION TO FIBONACCI LEVEL 0.5Hey Guys this is 4th Public Publish and first analysis on Waves usdt.
Reasons To Short...
1. A clear RSI Divergence on 1 Day chart.
2. BTC is also go under correction.
3. Failed Breakout of Rectangle Pattern on 1 Hour chart. Now it's break the support level. That's our entry point.
Let's talk about stoploss, entry and target.
Wait for rectangle breakout at 1 hr time frame...and short during retest around. 31.60-33.1.
Remember huge volume breakout is necessary...
STOP LOSS: 37.11
TP 1 28.1
TP 2 25.2
TP 3 22.3 (If it's rebound upto 23.1, before hitting the third target, close the rade. Don't fall in greed.
Enjoy.....If you make profit from this analysis comments, how much you make, and your trading experience n all.

WAVES /USDTAs you can see in the chart if it can break our resistance our next target can be 51.45
But if it could not first target for shorting is 29
This is not financial advice this is just my opinion
USE STOP LOSS IN YOUR TRADE
GOOD LUCK

WAVESWaves has been on a 250% move these past 4-5 Weeks under the radar following a strong upward trendline.
Currently price is on a retracement after reaching previous daily & weekly ATH *closes*
The long term trendline is still intact and price is staying above a strong support zone forming a triangle pattern.
Theoretically, you wan to place longs everytime price comes close to, touches, or rejects from the trendline.
Until Price can break this long term trendline, then WAVES will be a BUY.
There is a clear invalidation zone below 38% & the trendline.

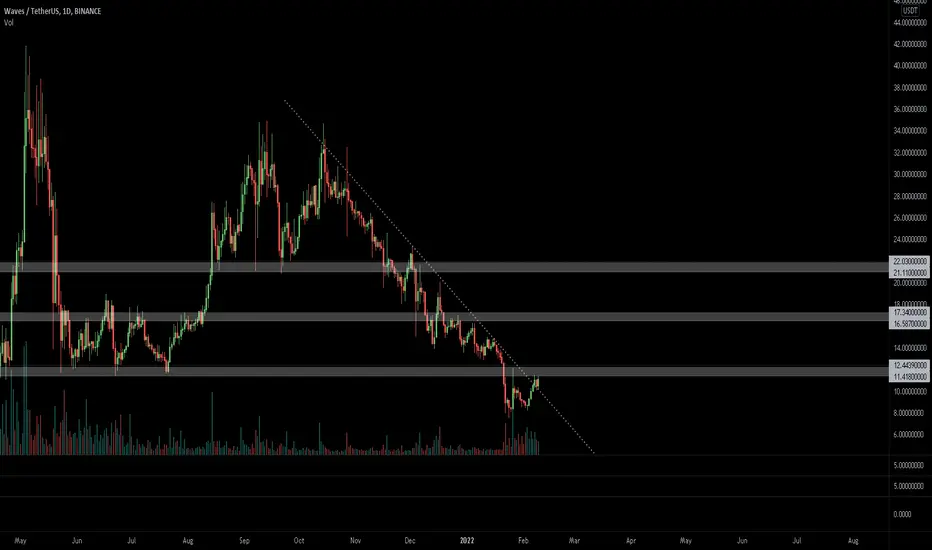
$WAVES, Something to watch if it starts clearing the 12$ area$WAVES
Something to watch if it starts clearing the 12$ area
UCTS signalling a 1D Buy
Volume activity getting stronger
BB bands getting tighter (usually a signal of a bigger movement to come)
Set some alerts =)
#WAVES
$WAVESUSDT UPDATE!!!Hi Snipers,
Please refer to the recording for the next price levels and scenarios.
Thanks
MS
