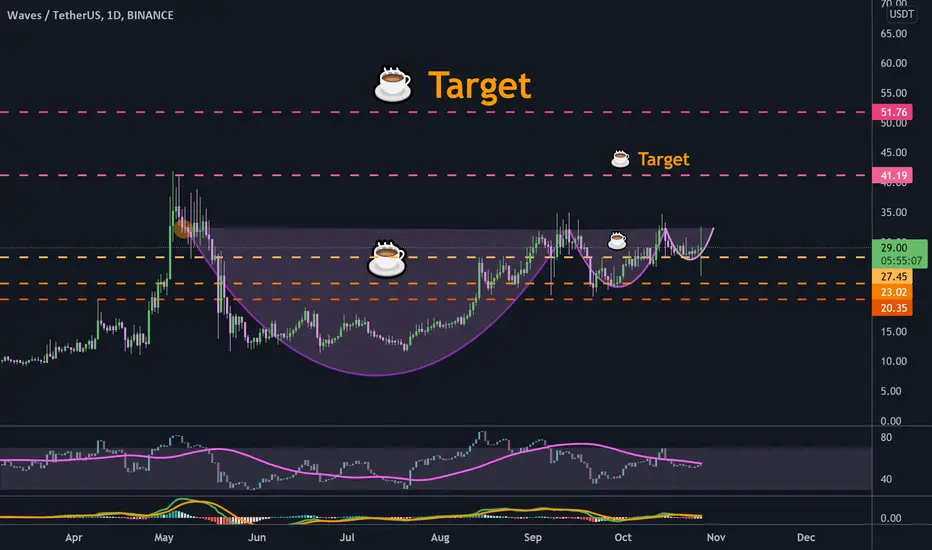
WAVES 2 cup and handle patterns#WAVESUSDT
$WAVES made 2 cup and handle patterns, the cup of smaller pattern is exactly 7 weeks.
bullish scenario: price will go up to complete the first C&H pattern at $40, and $50 will be the target of older pattern.
bearish scenario: if price close a daily candle below support of $27.45, it is possible to drop more to $23 and $20.
WAVESUSDT trade ideas
#WAVESUSDT (Watchlist) 10/21#WAVES maybe worth it to add this coin to your Watchlist. 👀
Everything mentioned on the chart (Pattern/Resistance/Support / Breakout/Breadkwon levels, Also R: R)
add to watchlist means the coin we mentioned is forming a pattern or moving near a historical bottom, around or above good support, increase in trading volume , showing a reversal candle, accumulation stage, etc, but no reaction from bulls, so we inform you to add it to your watchlist until the right time for entry.!!
Ps:
we avoid trading any coin if the entire project for it is based on gambling, prostitution, human trafficking, etc.
This is not financial advice, The purpose of these Charts is to give you an idea about coin movement (not buy or sell signal) so before following any idea be sure to do your own research, and follow your risk management. the Cryptocurrency market is very volatile and involves gains and losses as well so know very well what you are heading towards before engaging in it.
The information we mentioned here is a personal effort that is subject to success or failure and we welcome constructive criticism.
Pree "like button" and leaving your "comments" below our ideas is great thing and supports us in providing more ideas.❤️
Good luck to All.
🙏we ask Allah reconcile and repay🙏

WAVES 1DWaves is looking bullish 20 EMA providing support MACD loosing bearish strength. we can see good gains in waves

WAVES/USDT
4hr chart WAVES/USDT
Waves could be in the early stages of a ascending triangle retested the area of 33.44 only to get pulled back with sell pressure.
Been pulling back over the last couple days and with volume slowing its forming a falling wedge with 4hr bullish divergence.
waiting for the break and retest of the triangle to enter the trade.

WAVES/USDTHi Guys,
Hope you all are making good profits!!
here i m taking trade on waves/usdt ill tell you guys the reason behind it and what is logic behind thid trade.
so very first thing it was on 200 day moving average which is my faverate support or resistance level to trust upon
and then when we connect bottom swing low then we can see there is one trendline that the crypto is taking support every time that builds some conidence in trade
and then when we connecty fibonacci fro lower point to higher point we can see its on 50 % retracement level whiuch is strong support zone
a safe trader can draw trenline in upper side and wait for trendline break and initiat a trade but as im very confident about this trade i have entered already in this right away!
like comments!!

WAVESUSDTWAVESUSDT has bounced of the uptrend support with a strong rejection and possible double bottom on the daily timeframe, waiting for price to regain the neckline resistance for long entry confirmation which should take price to new All time highs.

Waves and altcoins looking upHello Traders,
This is a time we need to focus on waves and every altcoin with a slightly fast dump in the market.
in 1 and 2 hours timeframe we see signs of power, followed by this dump.
keep watching the market and do one step of buying.
stay tuned for next analysis
if interested, check out our last TA on bitcoin too.


WAVESUSDT Divergence and Cup and Handle PatternIf you wanna scan candlestick patterns, harmonic patterns , chart patterns, divergences, indicators automatically visit the our website cryptopy.net

WAVEUSDT IN PARALLEL CHANNELWhen the price hits the top of the channel, sell your existing long position and/or take a short position.
When the price is in the middle of the channel, do nothing if you have no trades, or hold your current trades.
When the price hits the bottom of the channel, cover your existing short position and/or take a long position.
If the price breaks through the top or bottom of the channel, then the channel is no longer intact. Do not initiate any more trades until a new channel develops.
If the price drifts between the channels for a prolonged period of time, a new narrower channel may be established. At this point, enter or exit near the extremes of the narrower channel.
#TAYOR HUOBI:WAVESUSDT


Sailing on the WAVES - where will our ship go?If you want to surf instead of sailing, go ahead ...
But first, take a moment and check out my thoughts about the current movements in this ocean.
Waves network is cheap and fast. There is or will be a high demand for Waves tokens because of its Exchange launch. Also, some protocols on Waves ecosystem have their airdrops announced: such as Vires, which offers high yields up to 100% even on stablecoins. Check yourselves, it's not an advice ;)
Last day closed with the green doji candle with a long wick upside. There were wicks like this before - there is some resistance around 35$ as we can see.
We are in the point where 3 supports meet:
- FIBO 61
- demand zone (green square with a green line inside of it)
- 1st trendline
Price action respects this area - a "doji* candle started forming there - it means indecision or a possible reversal
We also broke out a local correction (red falling line) which we can see better on the lower timeframe (15min)
During the time of writing this I missed a fakeout, there was a pump which appeared to be a bulltrap
Let's see what happens next ...

$WAVES /USD, UCTS flashing a 1D Buy signal $WAVES /USD
UCTS flashing a 1D Buy signal as its crossing above ~30$ resistance level
Volume spike yesterday, willing to see continuation today and a potential flip over this level
ATH just 30% away
#WAVES

WAVESUSDT *POSSIBLE* BEAR aheadRmbr, Proper risk management. After using trendline on candlesticks, and MACD indicator, I feel possible BEAR after retest of WAVESUSD

WAVES/USDT (Interval 1D) Cup & HandleMassive Cup & handle formation identified. This is going to get sent. GO WAVES!!!!

WAVES/USDT massive breakout ahead!!Hey crypto friends ! WAVES looking strong and ready for a breakout, wait for confirmation , clear skies ahead!!

WAVESUSDT Bullish Trend Middle term You can see chart we have bullish chart .
we had good news for start Exchange Waves .
So you can buy and hold this

WAVESUSDTHi
I am using X points to Enter and everything is clear on the chart.
In the near future we may have those points shown to Enter Trading Waves.
remember what is being shared is intended to give you a better understanding of next moves not a financial advice.
Entry:20 to 25
TP1: 41
Tp2: 62
TP3 : 85
SL: close Daily below 20
Exchange: Binance, Kucoin
This is our idea. not a financial advice.
GOOD LUCK

WAVEUSDTPERP 4h Trade IdeaHi, everyone.
In this trade idea I will be shorting the resistance area as there is a great supply zone.
I mix supply, and demand, support, and resistance concepts.
I am looking to scalp or get a 1:1 risk reward ratio.
The total crypto market overall is also having a hard time going to the upside as $BTC is near the resistance.

WAVES ascending triangleAscending triangle
Indicators on 1hr look bullish
I would like to see a price above 20sma soon...
Good luck traders


Wave 🌊 Breaking out on Monthly 🏄♀️WAVE is breaking out on the monthly chart. This is a good hold in a portfolio for potential gains.
Remember to like and follow for more breakouts alerts.
