WAVESUSDT Daily TimeframeSNIPER STRATEGY (new version)
It works ALMOST ON ANY CHART.
It produces Weak, Medium and Strong signals based on consisting elements.
NOT ALL TARGETS CAN BE ACHIEVED, let's make that clear.
TARGETS OR ENTRY PRICES ARE STRONG SUPPORT AND RESISTANCE LEVELS SO THEY CAN ACT LIKE PIVOT POINTS AND REVERSE THE WAVE (or act like a mirror that can reflects light) BASED ON STRENGTH OF THAT LEVEL.
ENTRY PRICE BLACK COLOR
MOST PROBABLE SCENARIOS TARGETS GREEN COLOR
LEAST PROBABLE SCENARIOS TARGETS RED COLOR
DO NOT USE THIS STROTEGY FOR LEVERAGED TRADING.
It will not give you the whole wave like any other strategy out there but it will give you a huge part of the wave.
The BEST TIMEFRAMES for this strategy are Daily, Weekly and Monthly however it can work on any timeframe.
Consider those points and you will have a huge advantage in the market.
There is a lot more about this strategy.
It can predict possible target and also give you almost exact buy or sell time on the spot.
I am developing it even more so stay tuned and start to follow me for more signals and forecasts.
START BELIEVING AND GOOD LUCK
HADIMOZAYAN
WAVESUSDT trade ideas


New ascending channel confirmed on 1 hour - WAVES PT $35The bottom of the 5 month ascending channel was touched on September 21st, 2021. Higher lows were then made just above the bottom of the channel on September 26th, 27th, 28th 29th.


WAVES accumulation phase - Bottom of the ChannelWAVES is currently at the bottom a formed Channel.
W's are being printed on all timeframes.
Support at $22.23
Target is the top of the channel.

$WAVES/USDT (3-5x) Direction LONGProbably the final grind down before a mid-term breakout, laddering orders all the way down to The lower range.
A breakout of the downtrend line will be followed by a nice rally and give us some huge profits.
TARGETS
Short Term: 24.40 - 24.80 - 25.50 - 26.50
Mid Term: 27.50 - 29 - 31 - 34
Best Regards, Reda Souhail™

WAVESUSDT - BEARISH SETUPWAVES has broke below the daily support with a bearish impulse, market has now bounced from oversold conditions and provided us with a correction to form a new lower high. Dropping to the 4hr timeframe we can see currently the market is above 4hr support, if however we see a 4hr close below this level of support we will be looking for entries to short on the retest of this zone.


WAVESIt is located below the level of the ascending channel
It is a good option for medium-term maintenance
The target can be considered the ceiling of the channel

WAVES bullishRSI seems to always bottom out here, looks like a triple bottom after breaking above resistance, send it. Only DEX I know remaining without KYC

waterfall or a new wave? The hourly rsi is in the oversold area which may trigger a bounce from this level, waves has been consolidating around the $30 area so it may climb to a new ath above $40

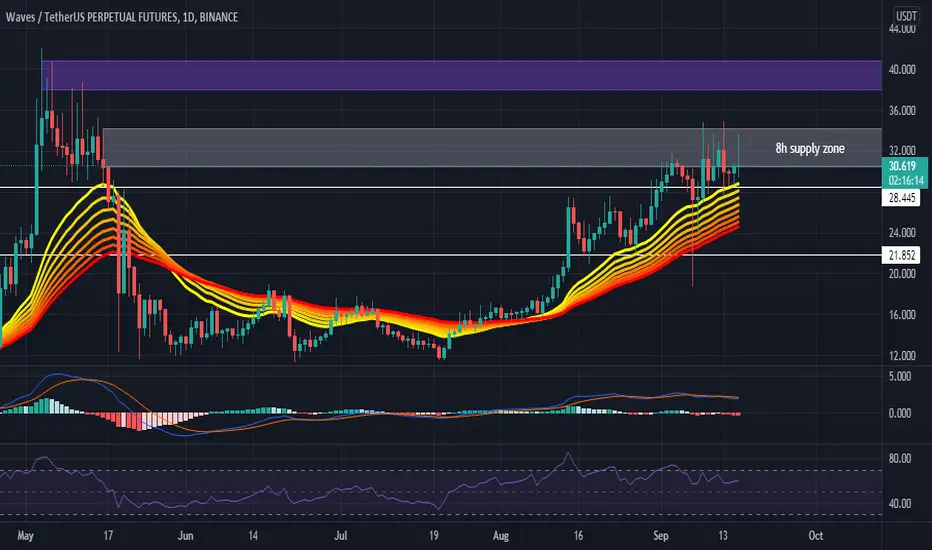
#WAVESUSDT Daily Chart
Price keeps getting rejected from the 8h supply zone and is failing to break through it ranging between the support at $28.445 and $32.5. MACD is bullish but RSI is bought and EMA ribbon is working as support as price is bouncing up from it. If it manages to break through the 8h supply we would be aiming for the highs and potentially new highs but if it breaks the support then we would be expecting it to reach $21.852 again.
Are you riding the WAVES?!Recently, the price was attempting to break out of the channel to the upside (extremally bullish) forming an ascending triangle, however it was rejected 3x times and fell down to the bottom trendline of the channel.
If you're not already in and want to join the party, this might be an opportunity.
Entry: Current price (29.2) - 28.1
TP1: 31.64
TP2: 33.47
TP3: 37.01
TP4: 40.90
TP5: OPEN++
Remember about risk management, especially that BTC has been quite volatile lately.

Waves UsdtWaves may climb up in few days. According to Tecnical analysis Fabinacci tool it will be rise again by 10%.
Need suggestion on this....

WAVESUSDT - Symmetrical triangle PatternWAVESUSDT(1h chart) Technical analysis
WAVES/USDT(1h chart) Currently trading at $32.26
Buy level : Above $32.81 (Buy after Breakout)
Stop loss: Below $30.14
TP1: $34.10
TP2: $3.40
TP3: $37
TP4: $38.80
Max Leverage 3x
Always keep Stop loss
Follow Our Tradingview Account for More Technical Analysis Updates, | Like, Share and Comment Your thoughts.

Waves to make a new ATHWaves is currently testing the trendline and if it bounces with strong buying pressure then we could see it rise to a new ATH however if the trendline is broken then this trade will not be valid.

WAVES|USDTHey hey my friends 👋
WAVES here is looking strong as long as btc allows it - once we break this resistance we will be launching a new leg into space!

Planning wavesusdt 10 september 2021- market structure on daily is uptrend
- price condition based on pairing daily MA and Weekly MA is strong uptrend
- the nearest support is at 29.56
- the nearest resistance is at 34.71
Strategy
- buy on golden area fibo
- TP 1 is at level 1 fibo
- TP 2 is at level 1.5 fibo

WAVESUSDT AnalysisWe are still Bullish on WAVES and haven't gotten any EngineeringRobo Sell signals. Nice little set up over the past few months. We can Sell here and/or take some profits or, if the Resistance Line gets an Open/Close candle, we Buy 20% more.

Waves Careful for btc everything you need is on photo
If btc lose his support it will be short for this one

Short Setup?rejection with divergence both happening on channel top, a short setup might be forming, just need a little more confirmation

WAVES 30% Profit after my call 🔥🚀WAVES 30% Profit after my call.
Waves still have great work to do, I will post an idea about the next targets.
