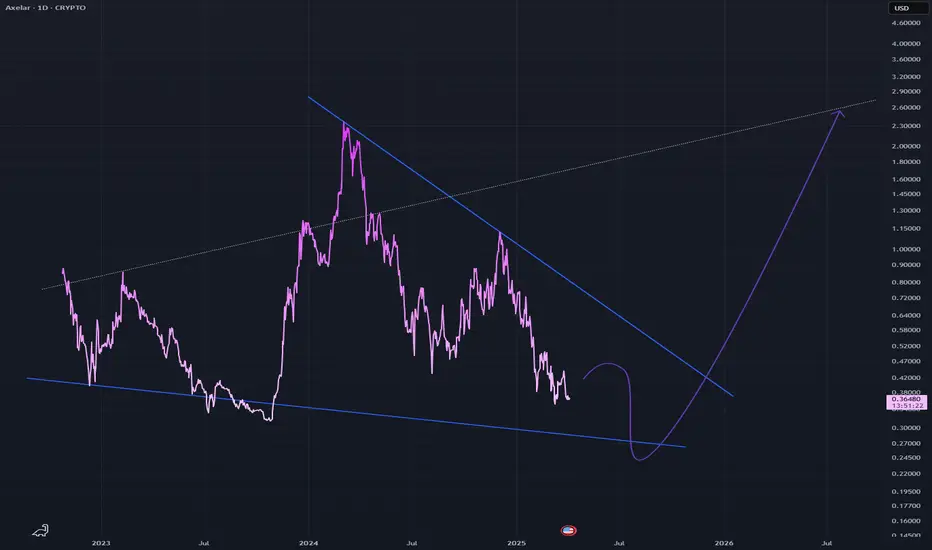
AXLUSD - Falling WedgeA falling wedge pattern which is a bullish pattern
This is on a long timeframe being the daily
I expect price to break out to the white dotted line
Daily timeframe
Key stats
AXELAR Stock Chart Fibonacci Analysis 021225Trading Idea
1) Find a FIBO slingshot
2) Check FIBO 61.80% level
3) Entry Point > 0.76/61.80%
Chart time frame: B
A) 15 min(1W-3M)
B) 1 hr(3M-6M)
C) 4 hr(6M-1year)
D) 1 day(1-3years)
Stock progress: C
A) Keep rising over 61.80% resistance
B) 61.80% resistance
C) 61.80% support
D) Hit the bottom

AXELAR - Setting up for a bullish wave, lots of potential gains!NYSE:AXL - Checkout the take profit targets I plotted. Great potential gains on the horizon.
Indicators heating up and flashing bullish soon.

AXL I see a megaphone pattern playing out .
With a target of 1,4$ approximately.
Around 22 januari .
*If the rest of the market stays in a healthy rythem up . With slight consolidations

Axelar breaking up from an inverse head & shoulders pattern. Axelar seems to be in the midst of validating a breakout upward from another nverse head and shoulder pattern. Target is $1.41 *not financial advice*

AXLUSD golden cross on approachAxelar (AXLUSD) has yet to see significant movement this cycle unlike alts, especially the other coins related to CRYPTOCAP:XRP ( CRYPTOCAP:XLM , BLACKBULL:SOLO , MEXC:COREUMUSDT ). As the market cycles into the lower caps I suspect COINBASE:AXLUSD and COINBASE:DIAUSD (both related to Ripple

AXLUSD - 4h Consolidation ZoneAXLUSD - 4h Consolidation Zone
If you like my AT, and you agree with the approaches, please FOLLOW ME and press BOOST so we can share it with more people. We are working on an automated trading tool so that everyone can apply their strategies in a VISUAL and PROFESSIONAL way, as we present in the a

Axelar breaking upward from symmetrical triangleHorizontal green trendline and 200ma(blue line) likely to act as resistance on the way to the target. *not financial advice*

AXLUSD 1D - Rises above $0.70AXLUSD 1D - Rises above $0.70
AXLUSD is a stock to watch. It had a continuous rise that took it to a maximum of $2.70. It is now trading at $0.60.
It has already overcome the downward trend and is settling its price to begin a new price escalation. It has to overcome the previous lower high at $0.

AXL 8R Trade Idea with Entry, Targets, and Stop LossAXL is down from entry and has tagged the previous weekly entry that sent price down 32% and then up 500% (47 cents entry to 32 cents low, and finally a rally to $2.7). Price has retraced this move back to the previous entry of 47 cents AND made another weekly entry at 57 cents.
Targets based on t

See all ideas