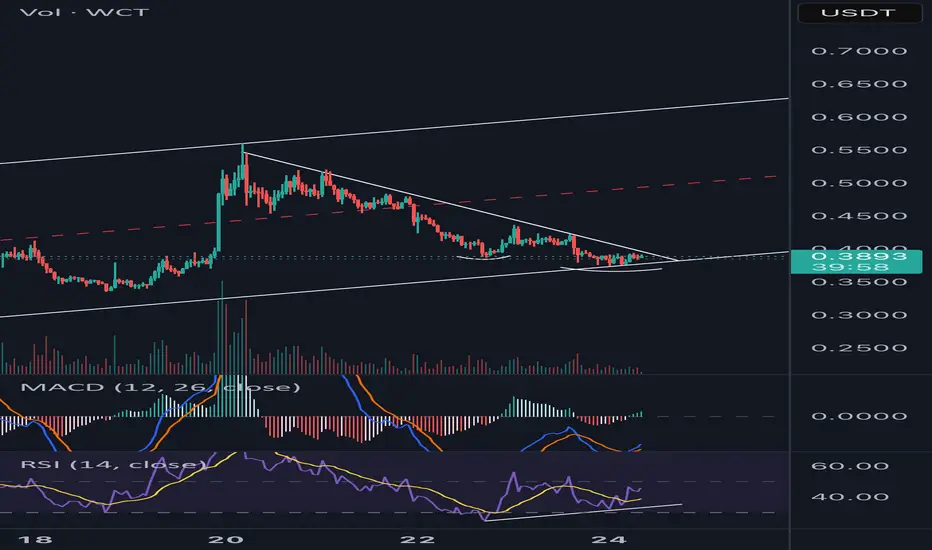
WalletConnect Reaches Support · Simple Signals · Simple StrategyI had to update this chart. It took longer than usual to move and this is always the case. Whenever we plan for 3 days we end up having to wait 10 days. If we plan to wait patiently for two weeks then the wait lasts six weeks and so on. Just be prepared to hold long-term and this can yield better results. No time, just get in when prices are low and hold. This works better.
WalletConnect finally bottomed 22-June and has been recovering slowly. This slow and steady recovery is always a signal of strength and tends to lead to a strong bullish breakout. When you see slowly rising prices for weeks or sometimes even months you know what the outcome will be, a major bullish breakout.
So we buy the support and wait, when the breakout comes, enjoy the profits.
Thank you for reading.
Namaste.
WCTUSDT trade ideas
3 days of breakoutmaking lower low on the 15mins. let see if it works. trading is crazy. monday to wednesday felt like a god. and now feel kinda dumb. everything is documented here

$WCTUSDT Just Broke the Downtrend, Big Rally Ahead?NASDAQ:WCT has broken out of a strong downtrend on the 6H chart, reclaiming key support around $0.3091.
This breakout from the accumulation zone signals fresh bullish momentum.
If the trend holds, the price could target the $0.6165 area, representing nearly a 99% upside from here.
DYRO, NFA

WalletConnect Hits Support, Recovery Wave Turns into Bullish-Wav"What goes up, must come down; What comes down must recover." It is a new saying.
Here we have WalletConnect trading at support. Once support is found, specially after a strong correction, we can expect the market to turn and produce growth.
Consolidation preceding the ath happened between late April and early May. This same zone is the one that was activated as a higher low. A clear support.
We sell at resistance and buy at support. Keeping it simple.
This pair is now a buy. Buy and hold.
Remember to do your own research and planning because market conditions can always change. While we expect a bullish breakout to happen within weeks or days, sometimes it can take months. It can take months but the end result is always growth. We are now in the 2025 altcoins market bull market so buckle up, it will be a wild ride, it will be profitable and it will be fun.
Namaste.

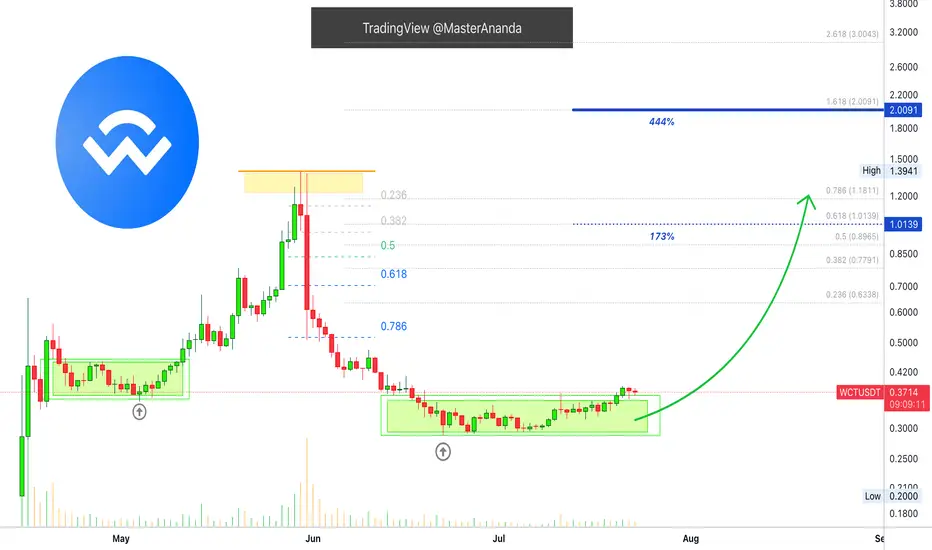
WallectConnect Grows Beyond 595%, Correction Time?The market always seeks balance. A strong bullish wave is balanced out by a retrace or correction. Here this type of scenario is already developing.
WallectConnect (WCTUSDT) grew strongly since April 15, as did much of the market but found a peak recently.
Total growth amounts to 597% from the market bottom. From the first support, some ~400% which is awesome. After the retrace/correction, you can expect additional growth.
The volume today as the all-time high was hit became the highest since April 16. Bearish volume that is. The highest bearish volume bar came right after the all-time high. This is a warning signal.
Do not rush to buy, wait for the establishment of support. Once support is found, you can go LONG. When the chart is bearish, now, the doors open to SHORT.
Remember to do your own research, numbers and planning.
Market conditions can always change.
When prices are high, do use a stop-loss if you decide to buy and hold.
(Only when buying (trading) at bottom prices the stop-loss is not recommended for spot.)
Namaste.

WCT/USDT make-or-break WCT/USDT is currently trading at a critical support zone — a make-or-break level for bulls. This area has historically acted as a strong demand zone, and I'm looking to DCA (dollar-cost average) long from here.
Entry Zone: Current price (Do or Die level)
Stop Loss: 0.594 (tight risk control)
Target: 35–40% upside potential
Risk management is key here. If the support fails, I’ll exit quickly. But if the bounce plays out, this could offer a strong R:R setup.
Not financial advice – just sharing my view. Trade safe

WCT/USDT Analysis: Joining the Long Trend
This coin is exhibiting a strong bullish trend, and we have now consolidated above the high-volume core zone of $0.94–$0.87, further confirming buyer strength.
If the price retraces into the marked zone, we will consider entering a long position.
This post is not financial advice.

WalletConnectToken WTC price analysisThe final acceleration of the parabolic growth of the #WCTUSDT price has now begun.
What price do you think #WCT will reach before the correction begins?
1.21; 1.43; 1.80; 2.23, or maybe not earlier than $3?
Write your options in the comments.
👨💻 Currently, the capitalization of the #WalletConnectToken project is only $200 million, with 19% of the maximum issue in circulation, and the largest trading volumes are in the Korean audience.
Anything is possible)
_____________________
Did you like our analysis? Leave a comment, like, and follow to get more

WCT/USDT – Breakout from Accumulation ZoneDate: May 20, 2025
WCT/USDT has just broken out of a clear consolidation range, showing strength after a sustained rally and a healthy mid-term correction. Price is now retesting the previous resistance as support — a classic bullish continuation pattern.
📊 Technical Overview:
Current Price: $0.6051
Key Breakout Zone: $0.57–$0.59 (now flipped to support)
EMA Structure: Price is above the 4EMA and trending upward, showing bullish short-term momentum.
Volume: Strong initial breakout volume, followed by a decrease during consolidation — typical of accumulation behavior.
📈 Entry Zones:
Retest Entry: Around $0.59–$0.60, ideal for confirmation traders.
Aggressive Entry: On breakout candle close above recent highs ($0.61+).
🧷 Validation:
The setup remains bullish as long as price holds above the $0.57–$0.58 zone.
A breakdown below this area would invalidate the bullish structure and suggest potential reaccumulation or rejection.
🎯 Target Projections:
TP1: ~$0.75 – near-term continuation target based on previous impulse projection.
TP2: ~$0.95 – extended move target assuming trend continues with momentum.
📊 RSI Analysis:
RSI is around 68–69, showing strong bullish momentum without being too overheated.
RSI broke above 70 recently, pulled back slightly, and is now curling back up — a potential signal of another leg up.
🧠 Final Thoughts:
WCT has shown solid breakout behavior followed by a textbook retest. If buyers hold this new support level, continuation to higher targets looks likely. Watch for volume confirmation on next impulse.

#WCT I am keeping a close eye on this currency.
I feel it will grow well.
The red resistance lines and arrows are clearly visible on the chart.
It is clear that a strong cross and of course a consolidation above it
can show a good pump.

How To: Automate TradingView Alerts to Real Trades The Easy WayHere’s a demonstration of how you can connect the dots using tools you probably already have: TradingView, email, and a simple automation setup on your computer.
How This Works
TradingView strategy spots a trade:
Your custom Pine Script runs on any chart, analyzing price action, trends, or pivots. When your strategy sees a buy or sell signal, it triggers an alert.
Alert lands in your email inbox:
TradingView sends a custom email alert (with your chosen keywords in the subject line) to your email account.
Your email app does the magic:
With a rule set up in Mozilla Thunderbird (or similar desktop email client), your computer can recognize the alert email as soon as it arrives.
Automatic trading bot executes the order:
The email filter launches a small program—your own buy or sell executable. This bot can be coded to interact with an exchange API (like Binance) and place the order, with whatever safety checks you want.
Step-by-Step Setup
1. Create Your Strategy in TradingView
Write your logic in Pine Script, or use any community script you like.
Set up an alert that sends you an email when a buy or sell is triggered.
Tip: Use specific words in the subject line like “order buy @” or “order sell @” to make automation easy.
2. Set Up Your Email Rule (Thunderbird Example)
Use Mozilla Thunderbird as your desktop mail client.
Go to Message Filters and create a new rule:
Condition: If Subject contains “order sell @” (for sell), or “order buy @” (for buy).
Action: Launch your chosen executable file (e.g., SELL SPOT AT MARKET PRICE.exe for sells, and a corresponding one for buys).
3. Create/Package Your Trading Bot
You can write your bot in Python and package it as a standalone .exe file with PyInstaller.
Example logic:
Connect to Binance using secure API keys (use keyring for safety).
On sell: place a limit sell order, and if it’s not filled in 30 seconds, cancel and execute a market sell instead.
On buy: same idea, but for buying.
4. Automate the Entire Chain
Once set up, the process is seamless:
TradingView strategy → Email alert → Thunderbird filter → Buy/Sell executable → Real trade
What’s Cool About This Demo
No manual clicking required.
You’re in control: Design your own entry/exit logic, risk management, and trade size.
Customizable: Works with any exchange that supports API trading.
Extensible: Add more rules, logging, or notifications as you wish.
Disclaimers
This workflow is for educational and demonstration purposes only.
You are fully responsible for your own trading actions, risk management, and system security.
I am not providing financial advice or trade recommendations.
Always test thoroughly—preferably with a demo account—before using real funds.
Keep your exchange API keys safe and never share your automation scripts.
How to Set Up Thunderbird to Process Emails and Trigger Scripts
This guide will help you configure Thunderbird to watch for TradingView alert emails and automatically launch your custom buy or sell executable file based on the alert type.
1. Install Thunderbird
Download Mozilla Thunderbird:
www.thunderbird.net
Install and open Thunderbird on your computer.
2. Add Your Email Account
Add the email address where you receive TradingView alerts (e.g., Outlook, Gmail, etc.).
Let Thunderbird sync your inbox.
3. Prepare Your Executable Files
Have your buy and sell trading bots packaged as .exe files (e.g.,
BUY SPOT AT MARKET PRICE.exe and SELL SPOT AT MARKET PRICE.exe).
Place these files in a known folder, such as
C:\Users\YourName\Documents\buy sell executables\.
4. Set Up Message Filters in Thunderbird
a. Go to the menu and choose
Tools → Message Filters...
or
Right-click your account in the left sidebar → Settings → Message Filters.
b. Click “New...” to create a new filter.
For a Sell Alert:
Filter Name: Subject contains: order sell @
Apply filter when:
✅ Getting New Mail
Match all of the following:
Subject contains order sell @
Perform these actions:
Launch File
Select your sell executable, e.g.:
C:\Users\YourName\Documents\buy sell executables\SELL SPOT AT MARKET PRICE.exe
For a Buy Alert:
Create a similar filter, but use:
Subject contains order buy @
Launch File → your buy executable, e.g.:
C:\Users\YourName\Documents\buy sell executables\BUY SPOT AT MARKET PRICE.exe
Tip: The “Launch File” action might require the “FiltaQuilla” add-on in Thunderbird, which enables advanced filtering actions like launching files.
5. Test Your Setup
Send yourself a test email with the appropriate subject line (e.g., order sell @).
If set up correctly, Thunderbird will process the new email and automatically run your chosen executable.
6. Going Live
Once tested, enable your TradingView alerts to email your account with the exact subject lines your filters are set to catch.
Your trading automation is now ready to work seamlessly!
Additional Notes
Security: Only set up automation on a trusted computer. Make sure your executables are secure and not accessible to others.
Logging: Consider adding logging in your Python bot to keep track of executed trades.
Add-ons:
If “Launch File” is not available, install the FiltaQuilla add-on in Thunderbird. After installation, the action “Launch File” will be available in the filter actions.
Summary Checklist
Thunderbird installed and set up with your email
Buy/sell scripts packaged as .exe files
Message filters set up for both buy and sell alerts
(Optional) FiltaQuilla add-on installed
Tested and working before going live

1.8 RR tradeShould be developed more/filled in 2-3 days I estimate. Target will need to be refined based on price action at the time. It's a new coin so less information for my trading methods.

$WCT Bullish Breakout +30% IncomingHello everyone, before i dive into MYX:WCT and explain why this will go to $0.87 cents could you do 2 things? My first request is giving me a follow and my second request is giving this publication a like.
Now lets dive into the technical aspects of MYX:WCT and why it will likely see a +30 move up.
As seen in chart below we had a very obvious trendline of resistance that formed over the space of roughly a month. I noticed this last night placed a long position in MYX:WCT and also shared this trade as a signal. That was when MYX:WCT was trading at $0.55 cents.
I have seen this same formation play out on many different altcoins and memecoins and it always seems to do the same thing break its historical trendline resistance and rally another +30% to +45%. I don't believe there is a name for this formation but i just call it the newly listed fake out to breakout, because the same thing has happened at least 50 times in the last year.
Tjat meams based off my own personal historical data i have collected MYX:WCT should go to $0.87 and may go as high as $0.95 within the next 3 days because that is how i have seen 50 other trade setups that were newly listed coins play out.
Thanks everyone for your support just wanted to give a quick update as mentioned at the top show some support by giving me a LIKE and a FOLLOW! Thanks

WCTUSDT Analysis — Breakout Confirmed, Watching Key Retest Zones📊 #WCTUSDT Analysis — Breakout Confirmed, Watching Key Retest Zones
🗓 Published: May 7, 2025
🕰 Timeframe: 4H | 📊 Exchange: Binance
🔍 Technical Overview
WCT has broken out of a falling wedge and is currently consolidating just above the breakout line. We're now watching two stacked support levels that could act as launch pads or risk traps depending on market reaction.
📌 Confirmed Patterns:
✅ Falling Wedge Breakout
✅ Bullish Retest Formation (clean HL)
✅ Price printing bullish structure above wedge resistance
🟦 Support Levels to Watch:
Primary Support: $0.3828
Last-Ditch Support (Panic Level): $0.3530
📉 Loss of $0.3530 = structure breakdown, invalidates breakout and may trigger further downside.
🟩 Current Price: $0.3998
WCT holding above breakout level and pushing higher with measured steps.
🎯 Bullish Targets:
TP1: $0.4340 – first breakout resistance
TP2: $0.4843 – local high
TP3: $0.6537 – full wedge projection target
Each level offers clear profit-taking points or re-entry zones if retraced cleanly.
🧠 Strategy Insight
Breakout traders may enter on retest, while conservative players can wait for confirmation above $0.434.
SL for aggressive entries = under $0.3828
SL for swing trades = under $0.3530
💡 Setup remains valid as long as both support zones are respected.
🗣 What’s Next?
Break and hold above $0.434 = momentum continuation.
Lose $0.353 = exit, wait for new setup lower.
📢 Smart money watches the retest. This setup offers tight risk and clear upside—trade the levels, not the emotion.
Please keep in mind that this is not financial advice and the purpose of these charts is to provide an idea of coin movement, not buy or sell signals. The cryptocurrency market is highly volatile and not suitable for everyone, so be aware of the potential risks before making any investment decisions. The information presented here is a personal effort and is subject to success or failure, and we welcome constructive criticism.
Good luck to all.
🙏we ask Allah reconcile and repay🙏

WCTUSDT: The Essential PlanWCTUSDT: The Essential Plan
Red Box (Resistance): This is your first checkpoint. Wait for a decisive breakout above this zone. No break, no play.
Blue Box (Support): If the red box breaks, the blue box is your potential long entry on a retest.
Critical Confirmation: At this blue box, insist on seeing bullish confirmation on at least the 1-hour chart . This is your main safeguard against a false move. Many will skip this; you shouldn't.
Your Action: Red box must break first. Then, if price tests the blue box, wait for that 1-hour bullish signal. No signal means no trade. This discipline is key to avoiding common traps.
This focused approach helps you prepare for a higher-probability setup.
And as always, I remain flexible. If the red box breaks but the blue box fails to give that 1-hour upward confirmation and breaks down, the long idea is invalid. We only act on clear, confirmed signals the market provides.
📌I keep my charts clean and simple because I believe clarity leads to better decisions.
📌My approach is built on years of experience and a solid track record. I don’t claim to know it all but I’m confident in my ability to spot high-probability setups.
📌If you would like to learn how to use the heatmap, cumulative volume delta and volume footprint techniques that I use below to determine very accurate demand regions, you can send me a private message. I help anyone who wants it completely free of charge.
🔑I have a long list of my proven technique below:
🎯 ZENUSDT.P: Patience & Profitability | %230 Reaction from the Sniper Entry
🐶 DOGEUSDT.P: Next Move
🎨 RENDERUSDT.P: Opportunity of the Month
💎 ETHUSDT.P: Where to Retrace
🟢 BNBUSDT.P: Potential Surge
📊 BTC Dominance: Reaction Zone
🌊 WAVESUSDT.P: Demand Zone Potential
🟣 UNIUSDT.P: Long-Term Trade
🔵 XRPUSDT.P: Entry Zones
🔗 LINKUSDT.P: Follow The River
📈 BTCUSDT.P: Two Key Demand Zones
🟩 POLUSDT: Bullish Momentum
🌟 PENDLEUSDT.P: Where Opportunity Meets Precision
🔥 BTCUSDT.P: Liquidation of Highly Leveraged Longs
🌊 SOLUSDT.P: SOL's Dip - Your Opportunity
🐸 1000PEPEUSDT.P: Prime Bounce Zone Unlocked
🚀 ETHUSDT.P: Set to Explode - Don't Miss This Game Changer
🤖 IQUSDT: Smart Plan
⚡️ PONDUSDT: A Trade Not Taken Is Better Than a Losing One
💼 STMXUSDT: 2 Buying Areas
🐢 TURBOUSDT: Buy Zones and Buyer Presence
🌍 ICPUSDT.P: Massive Upside Potential | Check the Trade Update For Seeing Results
🟠 IDEXUSDT: Spot Buy Area | %26 Profit if You Trade with MSB
📌 USUALUSDT: Buyers Are Active + %70 Profit in Total
🌟 FORTHUSDT: Sniper Entry +%26 Reaction
🐳 QKCUSDT: Sniper Entry +%57 Reaction
📊 BTC.D: Retest of Key Area Highly Likely
📊 XNOUSDT %80 Reaction with a Simple Blue Box!
📊 BELUSDT Amazing %120 Reaction!
📊 Simple Red Box, Extraordinary Results
I stopped adding to the list because it's kinda tiring to add 5-10 charts in every move but you can check my profile and see that it goes on..


$WCTUSDT.P: Possible bounce towards 5.2 USDTBINANCE:WCTUSDT.P using simple trends, support and resistance with ichimoku clouds..
Enter position if you like green PnL and have money to risk.
There is a level 4.6 in play (if it will rush through ichimoku clouds). #notfinanciladvice

WCT Breakout Confirmed – Ready for Lift-Off?🚀 WCT Breakout Alert – 80% Potential Incoming?! 👀🔥
Hey Traders! If you're all about high-conviction plays and real alpha, smash that 👍 and tap Follow for more setups that actually deliver! 💹💯
WCT has finally broken out of its long-standing symmetrical triangle on the 4H timeframe 🔥. After weeks of consolidation, we’re seeing a fresh move building up, hinting at strong momentum ahead.
🔎 Chart Insights:
✅ Breakout above resistance zone ✔️
📈 Retest happening around the breakout zone ✔️
📊 Previous pump: 81% surge! Will history repeat?
Trade Idea:
Entry: Current Market Price (CMP) and add more in dip
Targets: $0.44/$0.48 / $0.56 / $0.68 🎯
Stop Loss: $0.35 🚨
Lev: Use low leverage (Max 5x)
The chart looks clean with solid structure—keep an eye as this can build up for a big move 💥.
💬 What’s your take? Drop your analysis or ride along with this setup!

#WCT/USDT Analysis📈 #WCT/USDT Analysis 📈
MYX:WCT has broken the diagonal trendline on the 4H TF!
Now watching for a retest to enter a long position.
📊 Key Levels:
🔹 Resistance: PWH $0.446 | PMH $0.56
🔹 Support: PWL $0.3508
Let’s see if the breakout holds! 👀

WCT - BULLISHThe WCT/USDT pair is showing a strong bullish structure despite being a relatively new listing. After a period of consolidation within a descending wedge pattern, price action has successfully broken above the wedge resistance, indicating a potential reversal to the upside.
Key Technical Observations:
Breakout Confirmation: Price has closed above the descending trendlines (light and dark green), suggesting a trend reversal.
Support Level: $0.4239 – Price is currently retesting the breakout zone, acting as dynamic support.
Next Resistance Levels:
$0.5533 – Intermediate resistance aligned with the pink trendline.
$0.9973 – Major resistance zone.
$1.3510 – Ultimate bullish target area, highlighted with a red ellipse.
Measured Move Target: The technical projection suggests a potential 200% move from the breakout point towards the $1.35 region in the short to mid-term.
Market Sentiment:
Trading volume has started increasing, validating the breakout.
Bullish momentum indicators (e.g., RSI, MACD) are turning positive.
🚀 Short-Term Target: $0.9973
🎯 Mid-Term Target: $1.3510
This setup presents a high reward-to-risk opportunity for scalpers and swing traders alike, provided the $0.42 support holds.

WCT is it the dragon? Could this be a dragon structure o.mn Wallet Connect Toke? Good divergence on the rsi. Pray for a big tail!